 |
Measuring the mass-to-light ratio of Nearby Galaxies
In the 1970s, Vera Rubin used the velocities of 67 HII regions in the disk of M31 to show that the enclosed dynamical mass of the galaxy continued to rise out to at least 24 kpc, far beyond the optical radius (Rubin et al. 1970). Although they concluded that ``extrapolation beyond that distance is clearly a matter of taste'', by the 1980s, Rubin had shown that flat rotation curves (at radii up to 50 kpc) were ubiquitous in high luminosity spiral galaxies (Rubin et al. 1978). During this period, the work of observers and theorists converged, culminating in a collective assertion that galaxies are immersed in extended dark matter halos (e.g. Davis et al. 1985 , Frenk et al. 1985 ). Many subsequent studies have confirmed the early results of Rubin et al. (see Yoshiaki &Rubin 2001 for a review) contributing to a now overwhelming body of evidence demonstrating that dark matter constitutes a significant fraction (approximately 24%) of the total energy budget of the Universe (Freedman et al. 2003), a considerably larger fraction than that of baryonic matter.
Dark Matter provides the framework for cosmological structure formation and is essential for the creation and evolution of galaxies. The latest cosmological simulations, such the Evolution and Assembly of GaLaxies and their Environments (EAGLE; Schaye et al. 2015), are built on Dark Matter.
The goal of this project is to repeat some of the early observations that demonstrated the existence of dark matter by comparing the mass in stars to total (dynamical) mass. We aim to test whether a telescope on the roof of the Physics department can be used to repeat the early experiments of Rubin et al. and demonstrate the existence of dark matter. Here are some suggestions for the project and measurements you may wish to think about:
To identify a suitable target (or targets) and conduct observations of the galaxy. The galaxy (or galaxies) must have a rotation curve that can be used to infer the total dynamical mass. Observations need to be taken in the V-band, although addition B and R-band observations may be useful if observing time allows. Suitable targets may be identified from:
In order to get good photometry from Durham, targets will probably need to be brighter than ~11mag (depending on extent). They will also need to be visible during the night! (you can use the StarAlt tool to check this).
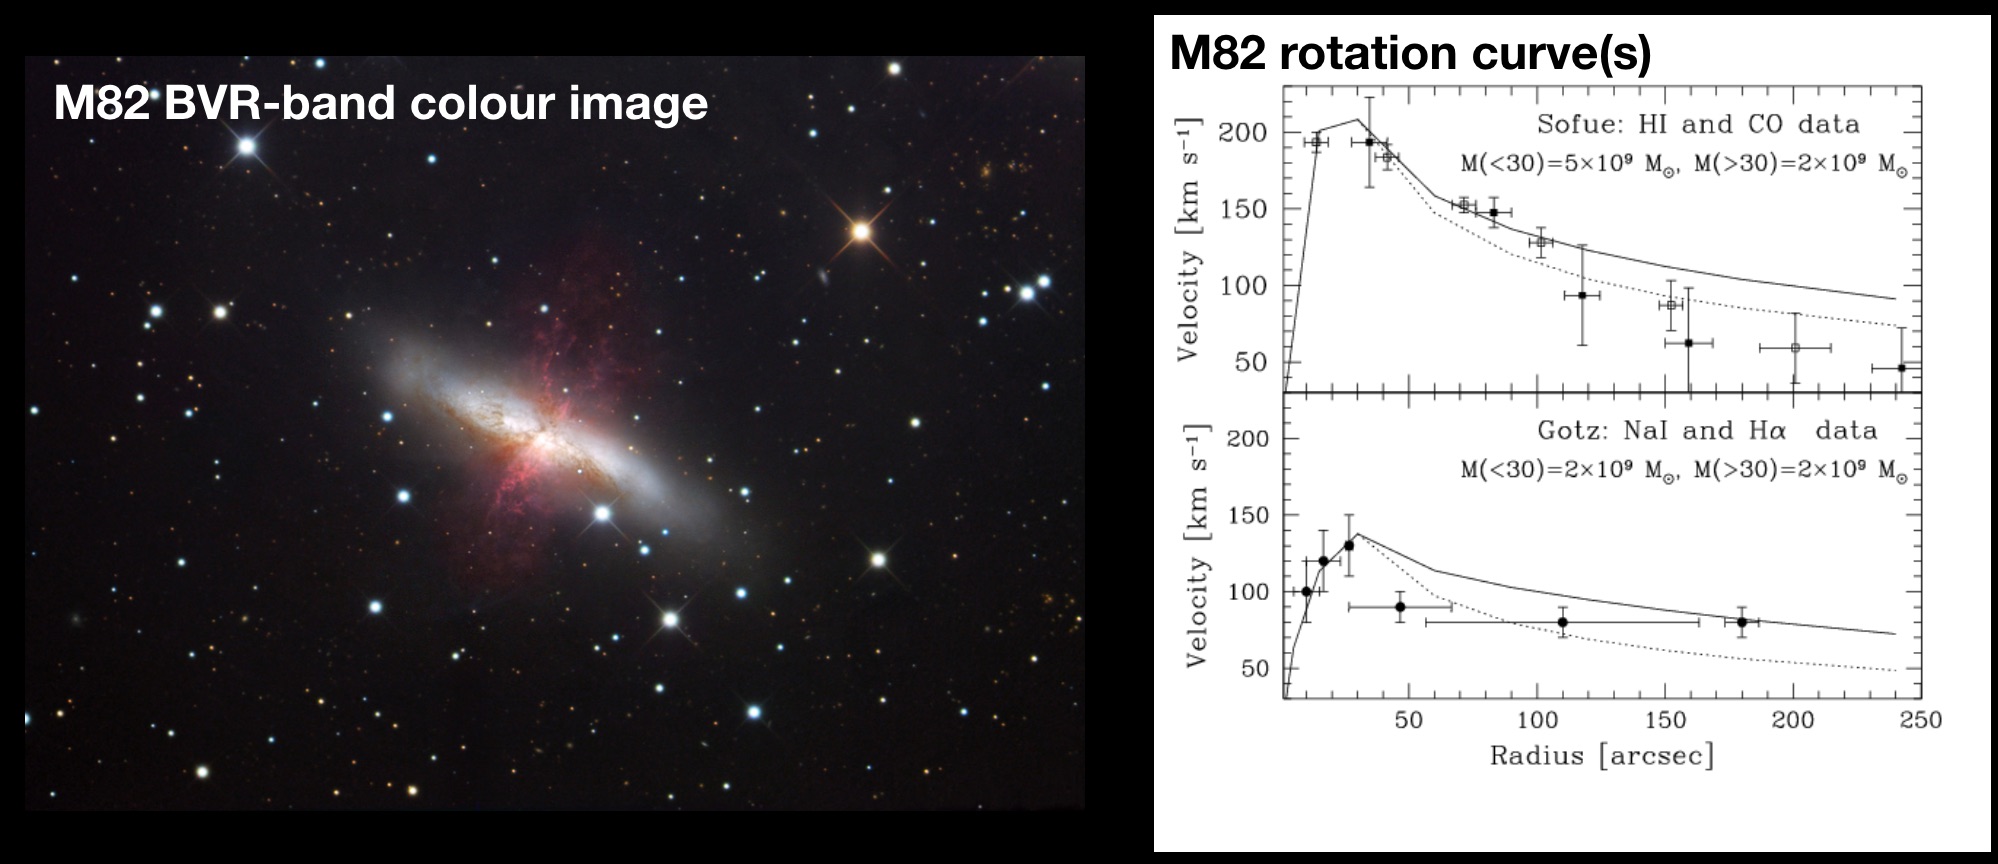
Previous targets have included M82, M81, NGC3898, NGC5533, NGC4527, NGC3198, NGC2403.
- Decide which band you want to observe in, and take a series of images of your target (the tracking on the telescope means that it is better to take many short images that one long one), but think about the trade off between number of exposures and exposure time [look at data in the archive to estimate whether the observations will be dark, photon, or sky noise limited].
Stack the images to construct a mosaic from which the measurements can be made. The stacking procedure is detailed here.
Derive the zero-point for the image. You can use Gaia to measure the photometry of some comparison stars to manually calculate the zeropoint, but the zero-point script can also be used to automate this. Information about the Python script which can be used to zero-point image can be found here.
Use GAIA to measure the magnitude of the galaxy from the mosaic, applying the zero point. Also, record the number of counts from the galaxy and sky background. Which dominates?
Calibrate the CCD to test whether the images are read-noise-, dark-current-, sky-noise-, or photon-noise- limited. You may want to check that signal is linear. For the read-noise, you could obtain a a set (short) dark images from which you can check the noise in a single pixel (or set of pixels). For the dark current, measure the signal in "dark" mode as a function of exposure time. What is the Bias level? Check the linearity to ensure your magnitudes are reliable? Measure the gain (why might this be important?)
With all of the calibrations made, calculate the error on the magnitude. Are the errors dominated by photon-noise, sky-noise, read-noise, or dark current?
Using the distance to the galaxy, calculate the absolute magnitude and hence total luminosity (in solar units). The V-band absolute magnitude of the Sun is 4.83.
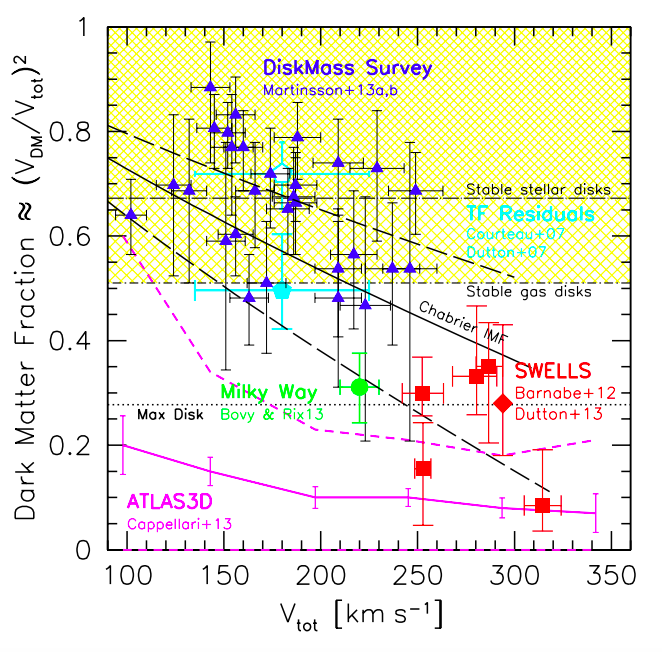
Using the rotation curve of the galaxy (with an inclination correct if neccessary) calculate the enclosed dynamial mass (in solar units) within the same radius as your derived stellar mass. What is the mass-to-light ratio? (i.e. how much of the mass, is "dark"? How does this compare to other galaxies with similar measurements (Figure below from Courteua et al. 2015):
Is the dark matter fraction a function of radius? Where is most of the dark matter?
What assumptions were made in these calculations? Are the measurements dominated by random or systematic uncertainties? Is the mass-to-light ratio dominated by random or systematic uncertainties? Are the assumptions you made reasonable and how could they be tested?
| Back to the AstroLab Home Page | ams | 2019-Feb-09 13:28:13 UTC |