Ultra-Deep Imaging at the WHT
Nigel Metcalfe, Tom Shanks & Dick Fong, University of Durham
 |
|
Figure 1. A 'true' colour image of the William Herschel Deep Field,
formed by
mapping U,B and R exposures onto Blue, Green and Red respectively. This
image is 7x7 arcminutes. Click here for a postscript version.
|
Ultra-deep imaging observations using powerful, ground-based telescopes
such as the WHT have the capacity to probe the evolutionary history of
galaxies back to their formation epoch. At the faintest galaxy magnitudes,
we are looking out not only in distance but back in time to when the
Universe was only a few percent of its current age.
Over the past few years, we have therefore used the William Herschel
Telescope to produce the deepest ground-based image of the sky which we
have called the William Herschel Deep Field (WHDF). With exposures of ~30hrs
in U and B, the resulting images reach magnitudes which are
comparable to the Hubble Deep Fields (U~27, B~28) but covering a five
times bigger area of the sky than the two HDFs combined.
As well as substantial exposures in the
redder optical bands from the WHT, the field has also been imaged in the
near-IR with a 30 hr exposure in K from the UKIRT IRCAM3, reaching K~23 in
a small central sub-area and a 14hr exposure in H from the Calar Alto
3.5-m Omega Prime camera covering the whole 7'x7' area and reaching
H~23 (McCracken et al, 2000a, McCracken et al,
2000b). Table 1 summarises the current situation.
| Band | Exposure (hours) | Magnitude Limit | Telescope |
| U | 34 | 27 | WHT |
| B | 28 | 28 | WHT |
| R | 8 | 26.5 | WHT |
| I | 5 | 25.5 | WHT |
| H | 14 | 22.75 | Calar Alto |
| K | 1 | 20.5 | UKIRT/Calar Alto |
| K sub-area | 30 | 23 | UKIRT |
Table 1. Magnitude limits and exposure times for the William Herschel Deep Field.
The WHT data were taken with the Prime Focus camera
using Tektronix or, more latterly, Loral CCDs.
The U-band observations were much enhanced by the Loral chips,
which have 3 times the sensitivity of the Tektronix at these wavelengths.
Data reduction was carried out using our proprietary software (Metcalfe et al.
1991,1995).
For many aspects of the studies of high redshift galaxies, the bigger area
of this Herschel Deep Field gives it a unique advantage over HST data. At
intermediate redshifts (1<z<3) the larger numbers of galaxies means that
they are more easily split into their various sub-populations by their
colours. At high redshift, the big area means we have more chance of
detecting candidates for galaxies in the redshift range 3<z<7 which are
within the magnitude reach of multi-object spectrographs on 8-10m class
telescopes for obtaining spectroscopic confirmation of their photometric
redshift. The bigger area of the also has advantages for studies of high
reshift galaxy clustering, aimed at understanding how structure forms in
the early Universe.
Figure 2 shows the B-band galaxy counts for the WHDF compared with other
data, including the Hubble Deep fields. Also shown are the predictions for a
universe in which galaxies do not evolve with time, and those for which
galaxies follow simple stellar population synthesis tracks
(Bruzual & Charlot 1993). Two geometries
are considered, q0=0.05 (open)
and q0=0.5 (flat) .
It is clear that non-evolving models underpredict
the counts from quite bright magnitudes (B~22). Even an open evolving model
struggles to keep up with the sheer numbers
of galaxies seen, although there are probably enough uncertainties in this
model to 'tweak' it higher at faint magnitudes. Those who favour a closed
universe have to relax the constraint that galaxy numbers are conserved
(e.g. merging) or at the very least invoke a population at high redshift which
has disappeared from view by the present day (e.g. fading dwarfs). The model
shown is a version of the latter.
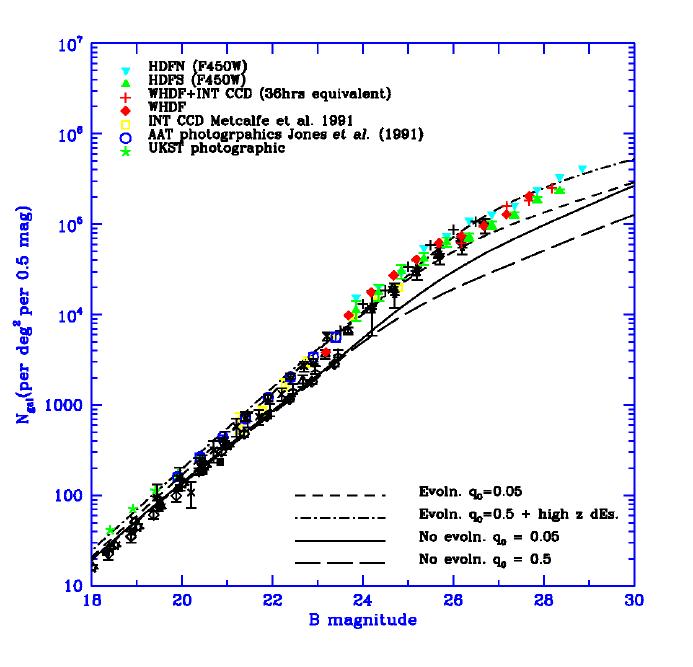
Figure 2. Differential galaxy number counts for the B-band, compared
with evolving and non-evolving models for low and high q0 . Durham
counts are shown with coloured symbols; b/w symbols indicate counts from
the literature. Click here for a postscript version.
One of the main tools for scientific analysis of these data is the
colour-colour
diagram. It might be thought that without spectroscopy it is impossible to
judge the redshifts of these faint galaxies, but Figure 3 shows this is
not the case. Here, simple stellar population synthesis evolutionary tracks
(Bruzual & Charlot 1993) have been
plotted for E/S0 and spiral galaxy types on top of the WHDF data. They
are colour-coded by redshift. The
'hook' of galaxies toward the bottom left of the diagram is clearly
identified with spirals tracking out towards redshifts of 2, whilst the
prominent 'finger' pointing upwards are low redshift ellipticals.
Highlighted in red are those galaxies with (R-H)>3.5. These are predicted
on the basis of their optical-infrared colours to be elliptical galaxies at
redshifts above ~1, in agreement with their location in Figure 3. Interestingly
the scatter in (R-H) (or (R-K)) for these galaxies is very high, spanning
almost 2 magnitudes.
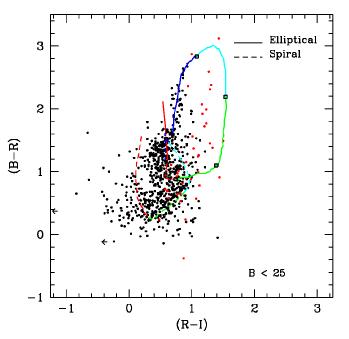
Figure 3. (B-R) v (R-I) colour-colour plot for the WHDF, showing
the predicted evolutionary tracks followed by elliptical and spiral galaxies.
Colours indicate redshift range; blue z<0.5, cyan 0.5<z<1, green 1<z<2 and red 2<z<3. The red dots indicate those galaxies which are relatively bright in
the infra-red ((R-H)>3.5) . Click here for a postscript version.
The infra-red colours are also useful for detecting clusters of galaxies.
Shown in Figure 4 are 'true' colour plots of a 1.3' box from the
WHDF formed by combining R, I and H images and U,B and R images. Notice the prominent string of red galaxies to the left side on the
RIH plot. This is a cluster, probably with a redshift between 0.5 and 1.
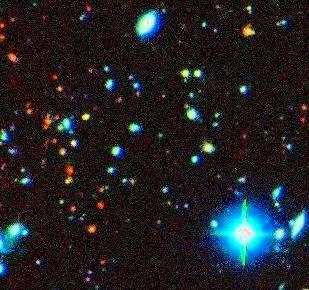
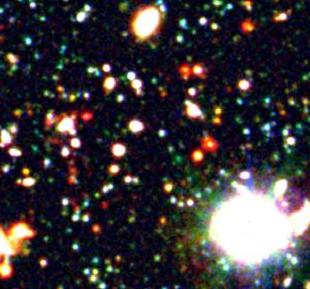
Figure 4. RIH (left) and UBR (right) 'true' colour images of
a small portion of the WHDF, showing the presence of a cluster at a redshift
of 0.5~1, identifiable by the presence of very red galaxies, particularly in
the optical-infrared image. Click here for a postscript version.
To identify high redshift galaxies the photometric 'dropout'
technique (e.g. Steidel et al. 1999) is perhaps the best known.
This relies on the presence of a
Lyman limit in galaxy spectra, shortward of which nearly all of the
flux is absorbed by intervening hydrogen. When this limit is
redshifted into a particular
filter the galaxy becomes very faint or disappears altogether, whilst
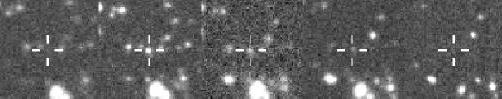
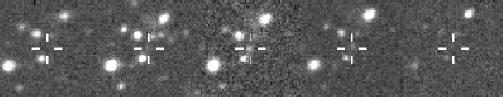
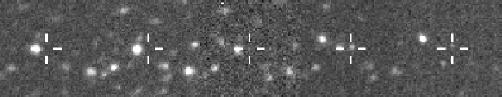
remaining relatively bright through redder filters. Figure 5 shows
three examples of such galaxies identified on the WHDF; a 'dropout' from
the U-filter, implying z>3, a 'dropout' from both U and B (it is still
faintly visible in B, but remember that this exposure is much deeper than
the others), implying z>4, and a potential R-band 'dropout', which could have
a redshift above 6 !
Figure 5. Top panel - an example U-dropout galaxy at B~25.0; Middle panel - a potential B-dropout galaxy with R~24.3; Bottom panel - a candidate R-dropout with I~23.8 . Click here for a postscript version.
Using the 'dropout' technique in several bands enables us to plot the
number count of galaxies at various redshift intervals. These can then be
compared with simple evolutionary model predictions. Figure 6 shows such
a plot for z~6 galaxies selected by R-band 'dropout' - we have included points
from the Hubble Deep Fields (F606W 'dropout') and also shown the numbers of
spectroscopically confirmed galaxies from surveys in the literature. We also
plot the counts expected on the basis the same simple luminosity
evolution models as used in Figure 2.
These models reproduce well our
own data, and that of Steidel et al., at lower redshifts, z~3.
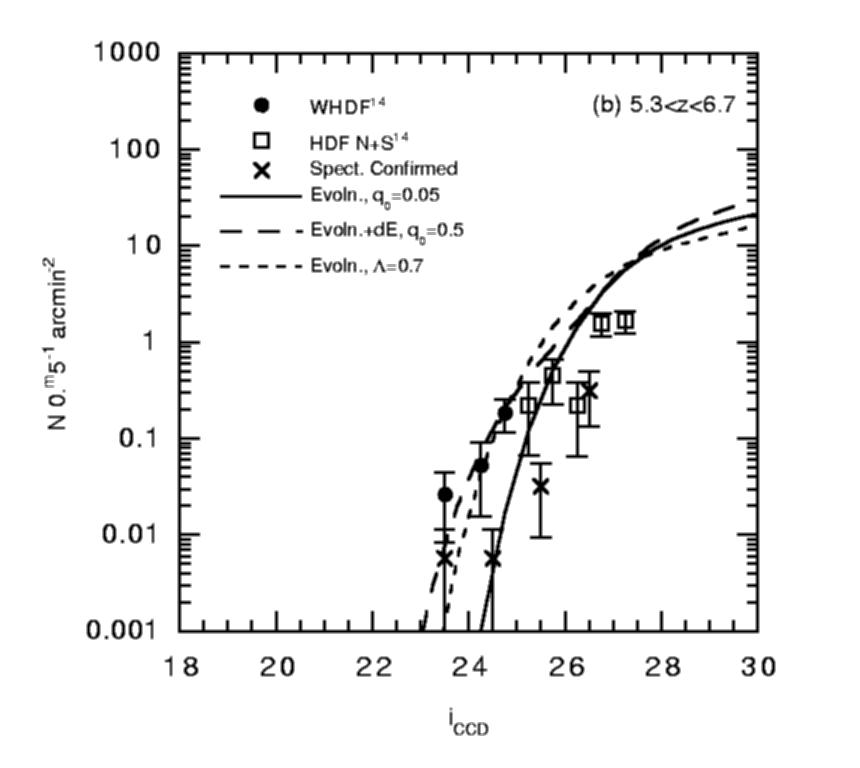 Figure 6. Numbers of R-band 'dropout' potential z~6 galaxies,
together with the handful of spectroscopically confirmed such objects,
compared with the predictions of simple luminosity evolution models. Click here for a postscript version.
Figure 6. Numbers of R-band 'dropout' potential z~6 galaxies,
together with the handful of spectroscopically confirmed such objects,
compared with the predictions of simple luminosity evolution models. Click here for a postscript version.
It is remarkable how well these simple models match this ultra-high
redshift data. The fact that a population of spectroscopically confirmed
z~6 galaxies have already been identified and that even larger numbers of R
dropout candidates exist in both the Herschel and Hubble Deep Fields
indicates that significant numbers of luminous galaxies were already extant
at these redshifts, pushing the epoch of formation of giant galaxies
back even earlier.
Looking to the future, we return to the WHT later this year with the aim
of using the new mosaic camera to image in R,I & Z to look for R-band
dropouts to fainter magnitudes and over a wider area. Such candidates will
be ideal targets for the GMOS spectrograph on the new GEMINI-N 8-m telescope.
References
- Bruzual A.G. & Charlot S., 1993, ApJ, 405, 538.
- McCracken, H.J. et al., 2000, MNRAS, 311, 707.
- McCracken, H.J. et al., 2000, MNRAS in press.
- Metcalfe, N. et al., 1991, MNRAS, 249, 498.
- Metcalfe, N. et al., 1995, MNRAS, 273, 257.
- Steidel, C.C. et al., 1999, ApJ, 519, 1.