The Browser Window
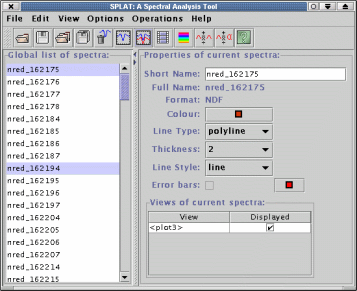
This image shows the "browser" window of SPLAT. This is the main
window where a list of all the spectra (and their plotting properties)
is maintained (the "Global list of spectra:"). In this case it is
clear that SPLAT has opened quite a lot of spectra, some of which are
displayed elsewhere, in a window called "<plot3>".

The Plot and Panner Windows
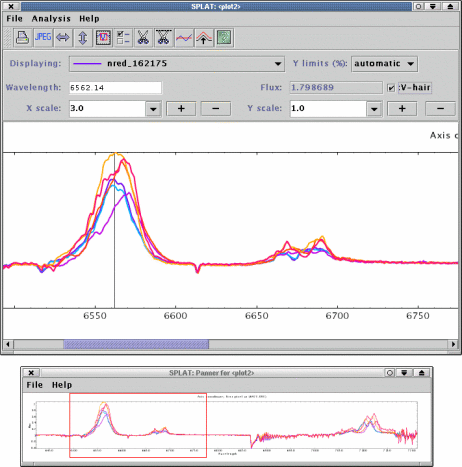
This image shows SPLAT plotting several spectra in a "plot" window
together with a "panner" window that shows the full unzoomed spectra.
Using a plot you can zoom and scroll around large spectra and
interact with them. For instance there is a continuous readout of
wavelength and data counts and you can drag out a region of the
spectra to zoom into. Interactive plot graphics are also used by many
of the tools (see you can see these in the toolbar area) to define
ranges for fitting polynomials and spectral lines, as well as regions
of the spectra to extract.
The panner window allows you to drag the red rectangle around to
change the region shown in the plot, you can also click on features
to have them brought into the main view.

The On-line Help
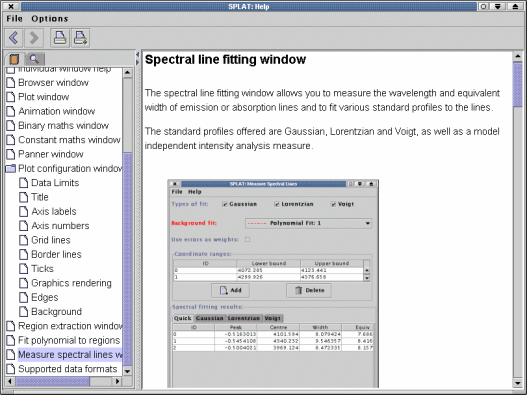
SPLAT has an integrated on-line help system. This describes how to get
started using SPLAT and has help for each of its main windows. In the
example shown here you can see the start of the help on how to
interactively fit spectral-lines.

The on-line help also features sections on how to get started using
SPLAT, as well as help for each window.
Line fitting
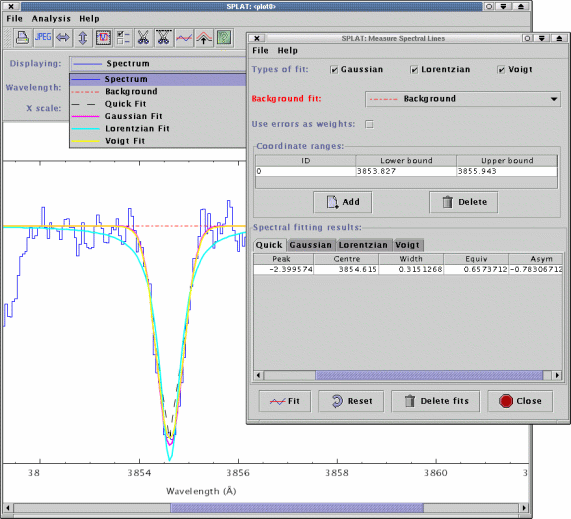
In this image SPLAT is shown fitting a spectral line. Just for example
it is fitting a single line using it's full repertoire of profile
models -- Gaussian, Lorentzian and Voigt -- as well as the making its
more usual intensity based measurements of line position and
equivalent width.

|