SPLAT Summer 2003 pictures
In this release SPLAT has become part of the Starlink Java
Collection and is now released under the GPL.
The major changes to SPLAT in this release are:
-
Facilities to view and edit spectra in a table, with undo
support.
-
The incorporation of a set of standard line identification
catalogues for optical, IR and sub-millimetre.
-
Full support for spectral coordinate systems.
-
A new toolbox for filtering and smoothing spectra.
Other changes include the ability to delete as well as extract
parts of spectra, to specify the types of spectra when the file
extension is not one of the standard types and to drag-and-drop
spectra from the global to plots.
The spectral editor
This figure shows SPLAT editing the data of a spectrum with a
bad skyline subtraction. The bad values have been replaced with
zero.
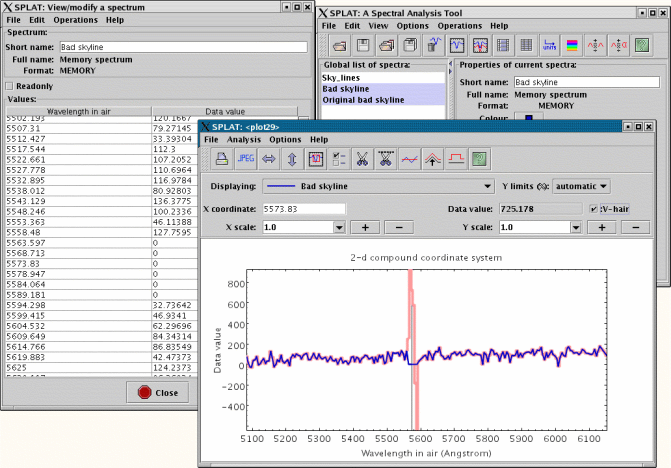
In addition to direct editing of individual values you can also
use an algebraic expression to transform all the values of a
column. It is also possible to add noise or generate a error
column, add model lines and red or blue shift coordinates, as
well as insert and delete rows. All changes are undo and
re-doable and are immediately displayed in any views of the
spectrum being changed.
Standard line catalogues
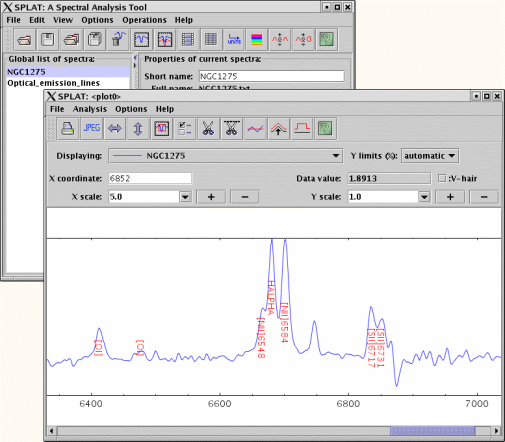
This figure shows SPLAT displaying a galaxy spectrum together
with optical emission lines loaded from a standard
catalogue. Note that the lines have been transformed to the rest
frame of the galaxy.
As well as optical there are also IR and sub-millimetre wavebands
catalogues, but, you can also import external catalogues using a
standard text format.
Spectral coordinates
In this release SPLAT now makes use of the new SpecFrame and
SpecMap provided by the Starlink AST library. This means that it
is now possible to fully describe the spectral coordinate
systems of all your spectra. This information can be added by
you using a new SPLAT toolbox or derived from your data's standard
encoding (FITS paper III or NDF WCS).
The main coordinate system types supported are, wavelength,
frequency, energy and velocity. Which can be qualified by their
units (angstroms, milli/nano/micro metres, Joules, ergs,
electron volts, mega/kilo/giga hertz, metres/kilometres per
second etc.) and the two associated systems of rest frame
(i.e. where the observations were made and of what).
This information can be used to align spectra and line
identifications automatically and perform operations like change
of rest frame (say from topocentric to heliocentric, or centre
The figure displaying line identifications was produced by
aligning a spectrum at rest with the source (i.e. as if the
standards were observed alongside the galaxy) to one taken at a
telescope on the Earth (the galaxy observation).
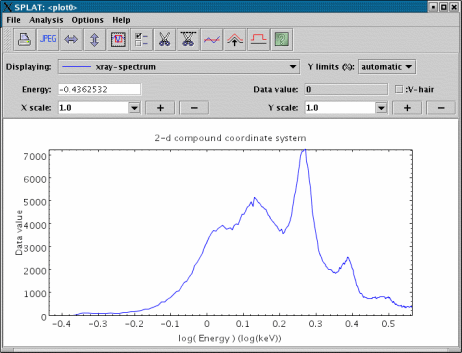
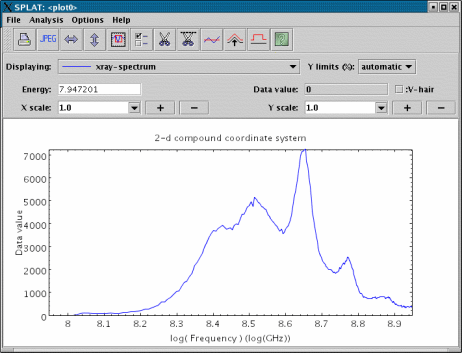
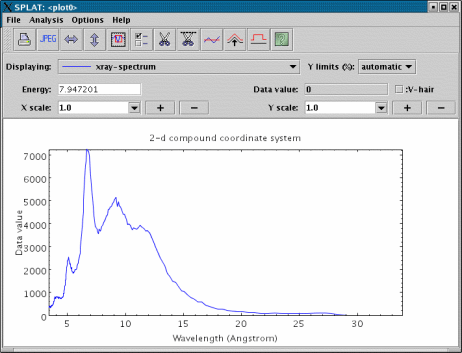
The next figures show an X-ray spectrum displayed in various
coordinate systems. This was all created from the same data.
Smoothing and filtering
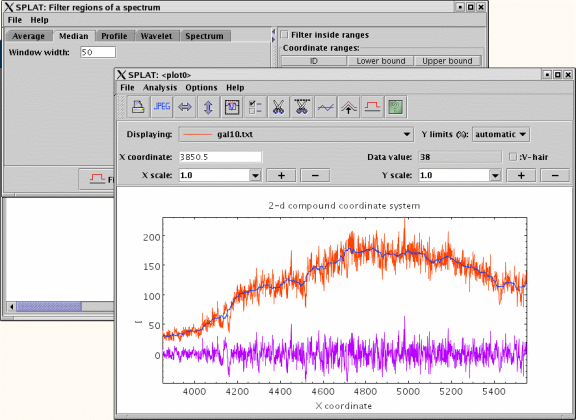
In this release SPLAT has now various smoothing filters added.
These are:
- Average - take the running average value over a
number of positions.
- Median - take the running median value over a
number of positions.
- Profile - smooth the values using a profile matched
to typical line shapes, Gaussian, Lorentzian and Voigt.
- Spectrum - smooth the values using a profile
defined in another spectrum (allows you to create kernels
that match some shape, rather than just the standard
profiles).
- Wavelet - use various wavelet filters to convert the
spectrum into multiresolution coefficients, removing a
fraction of the coefficients, thus "denoising" the
spectrum.
|