
CEA News, November 2020
Analysis of the metal content in distant star-forming galaxies
In astronomy the metal content, or metallicity, of a galaxy is a measure of the abundance of elements heavier than Hydrogen. The flux contained within an emission line from a chemical element is proportional to the abundance of that element in the medium. Therefore by measuring the ratio of the fluxes in emission lines from different chemical elements present in the spectra of a galaxy, the metal abundance (metallicity) of the galaxy can be constrained.
In a recent paper led by astronomers at the CEA, both the galaxy integrated metallicity as well the metallicity as a function of radius (metallicity gradient) are measured. This allowed them to analyse how the metallicity of the galaxies in the sample correlates with other fundamental properties of the galaxies such as stellar mass, star-formation rate, rotation velocity and morphology. The spectra of the galaxies in the sample were obtained using observations on the K-band Multi Object Spectrograph (KMOS) on the Very Large Telescope in Northern Chile. Using the KMOS data in combination with ground based and HST imaging, they were able to measure stellar masses, star-formation rates and morphologies of the galaxies in addition to their metal content.
The team confirms that the total metal content of the galaxies correlates positively with their stellar mass and negatively with star-formation rate. They also identify that irregular galaxies have a lower metal content at fixed stellar mass compared to compact and disk galaxies. Finally, they show that the metallicity gradients of the galaxies negatively correlate with stellar mass (more negative gradient at higher stellar mass, where negative gradient Is metallicity decreasing with increasing distance from the centre of the galaxy) and but exhibit no variation between compact, disk and irregular galaxies.
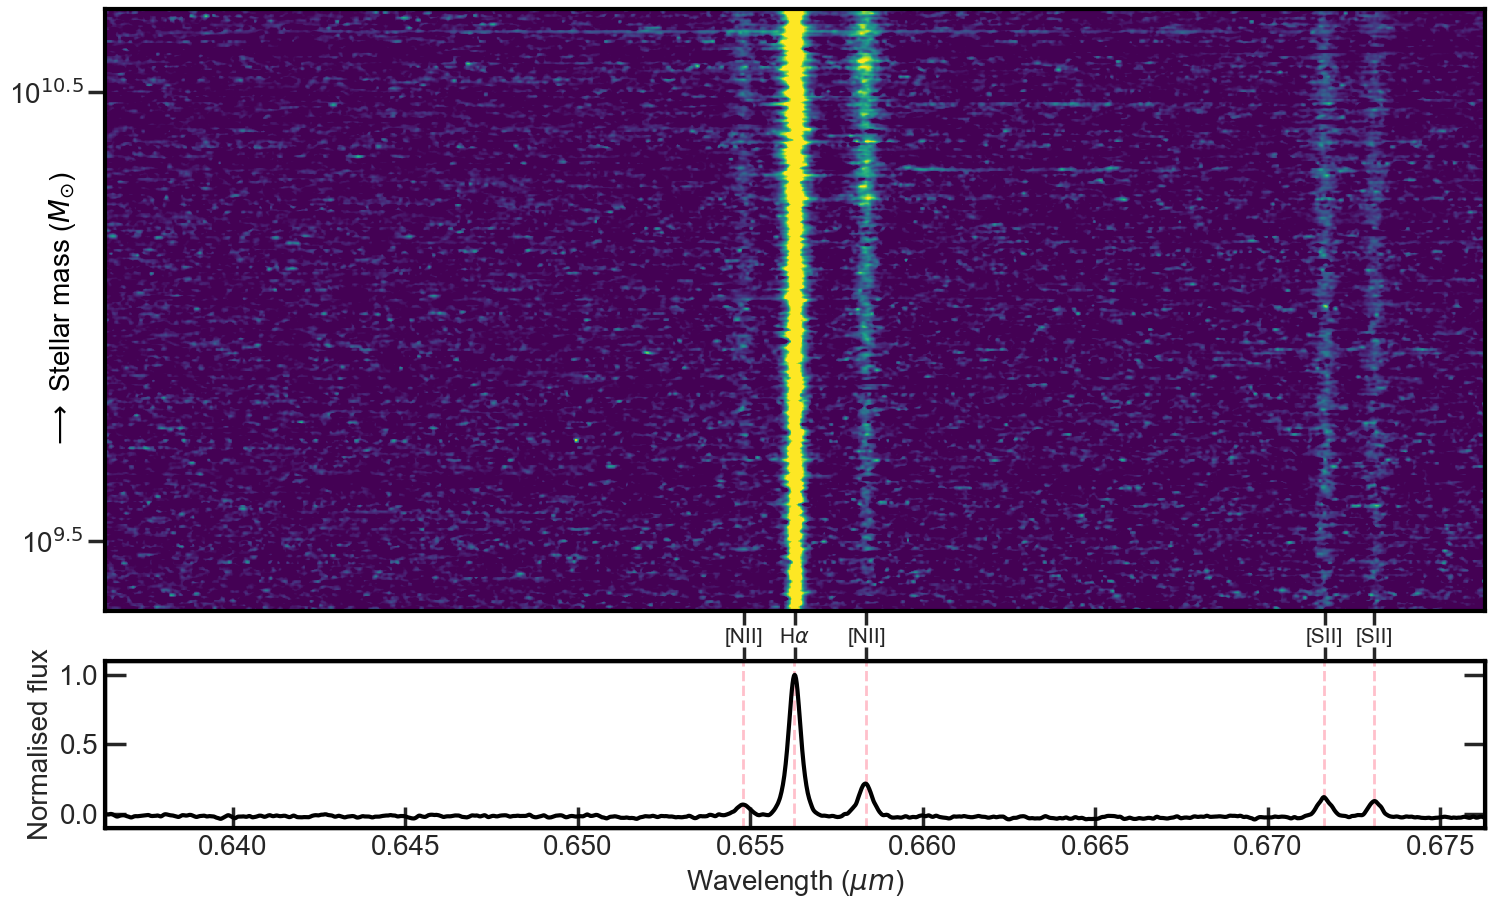
In Figure 1, to the left, the top panel shows the KMOS spectrum of all 650 galaxies ranked by stellar mass with emission lines indicated. The Halpha line is present in all, whilst the [NII] only appears in higher stellar mass galaxies. The bottom panel shows an average spectrum of all galaxies, again with emission lines indicated.
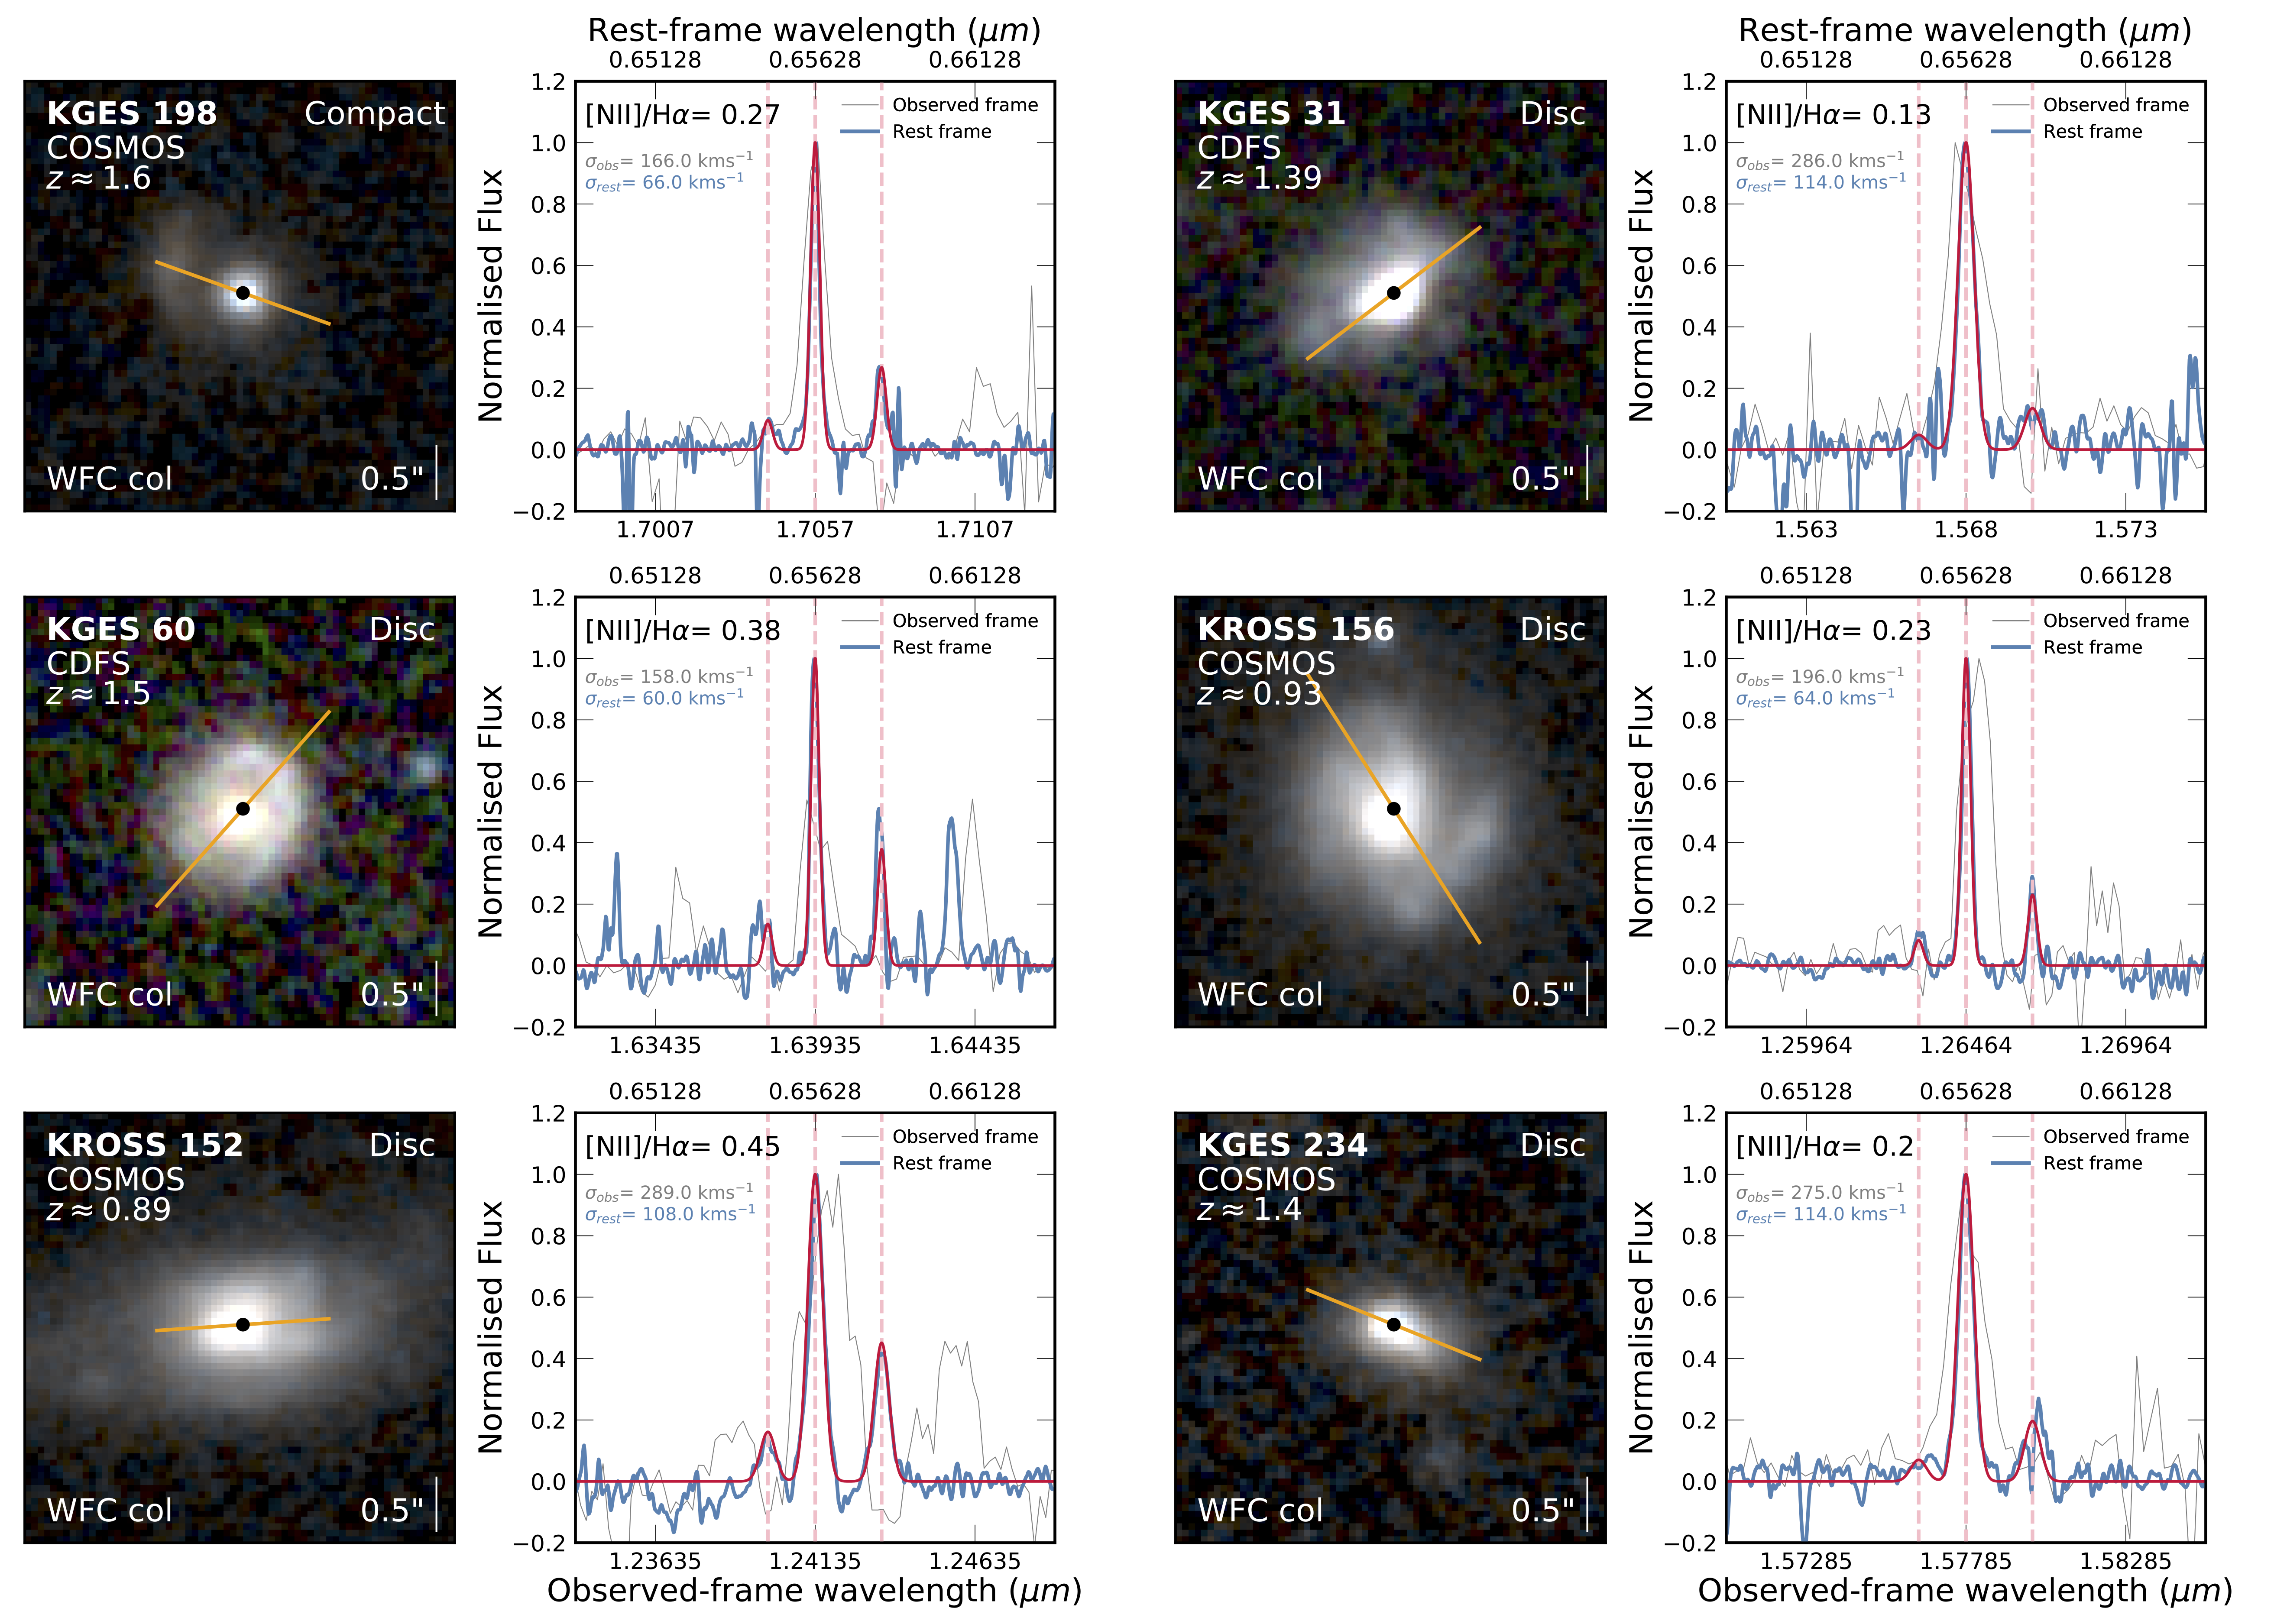
Figure 2, to the right, shows examples of the HST colour images and KMOS spectra for a number of galaxies. Each HST image shows the extragalactic field, spectroscopic redshift and morphology. The orange line is the semi-major axis of the galaxy and black is the stellar continuum centre. The KMOS spectra show the raw spectrum, the Gaussian profile fits, velocity dispersions of the lines and the integrated [NII]/Halpha ratio for each galaxy.