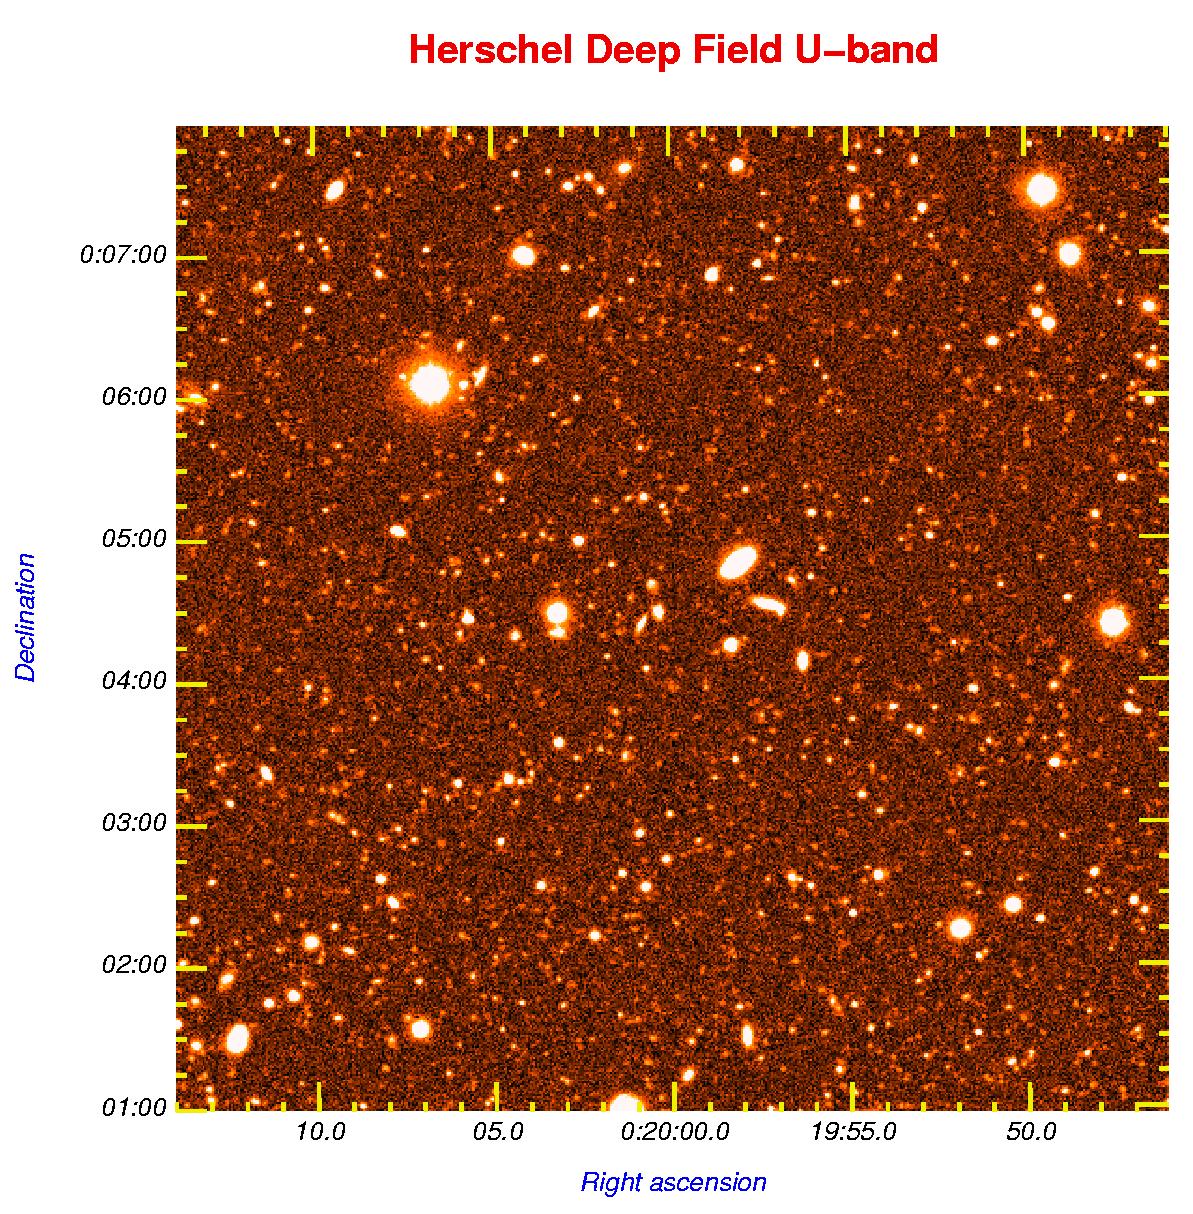
The William Herschel Deep Field (WHDF) |
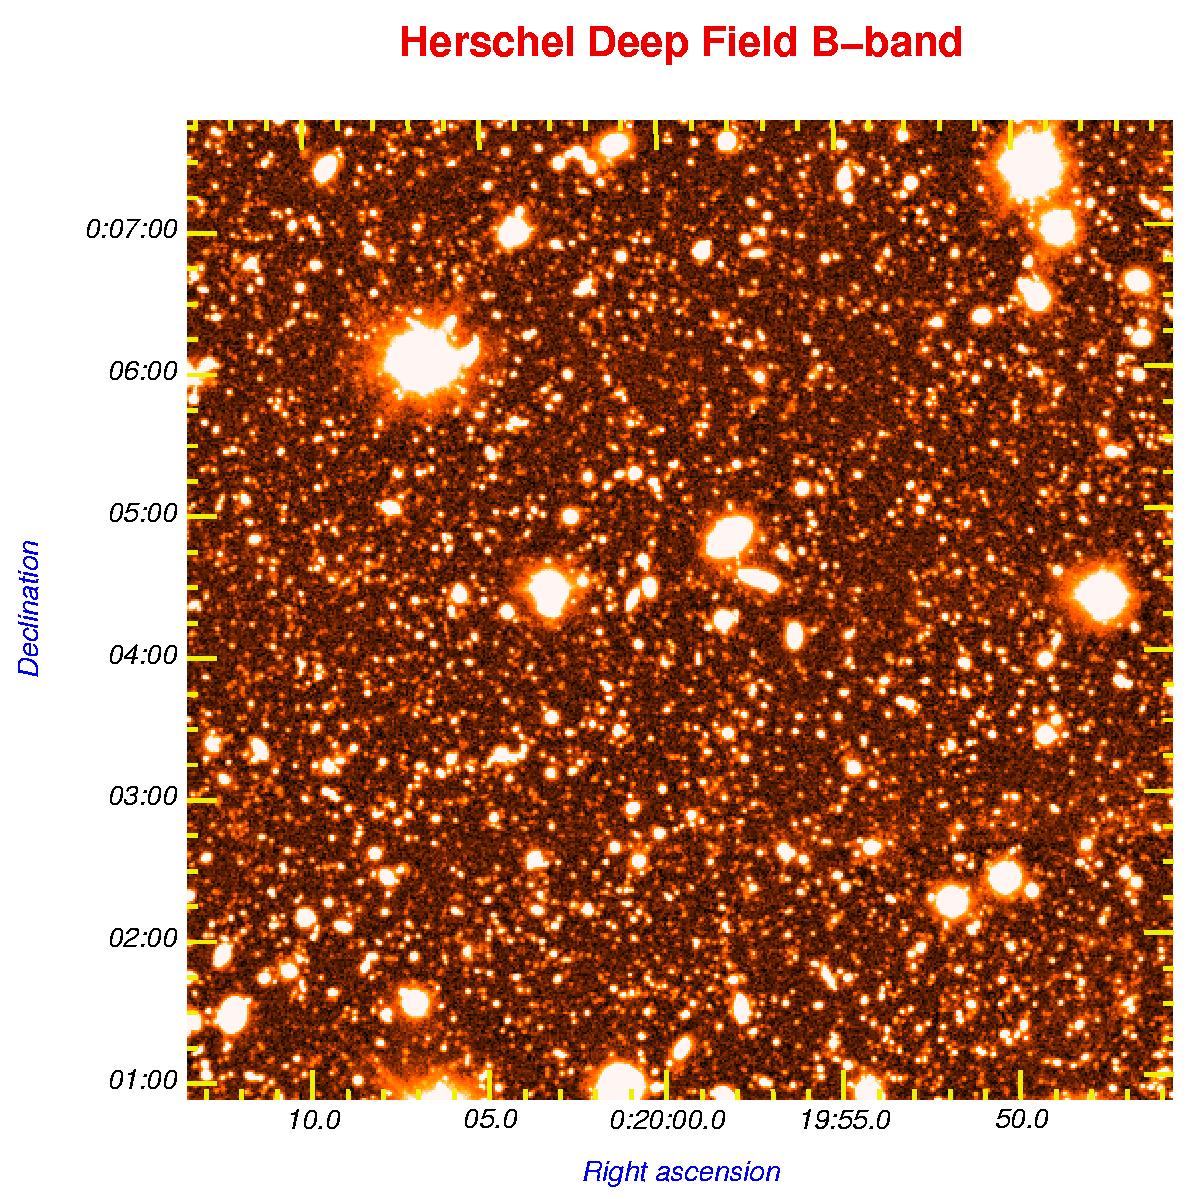
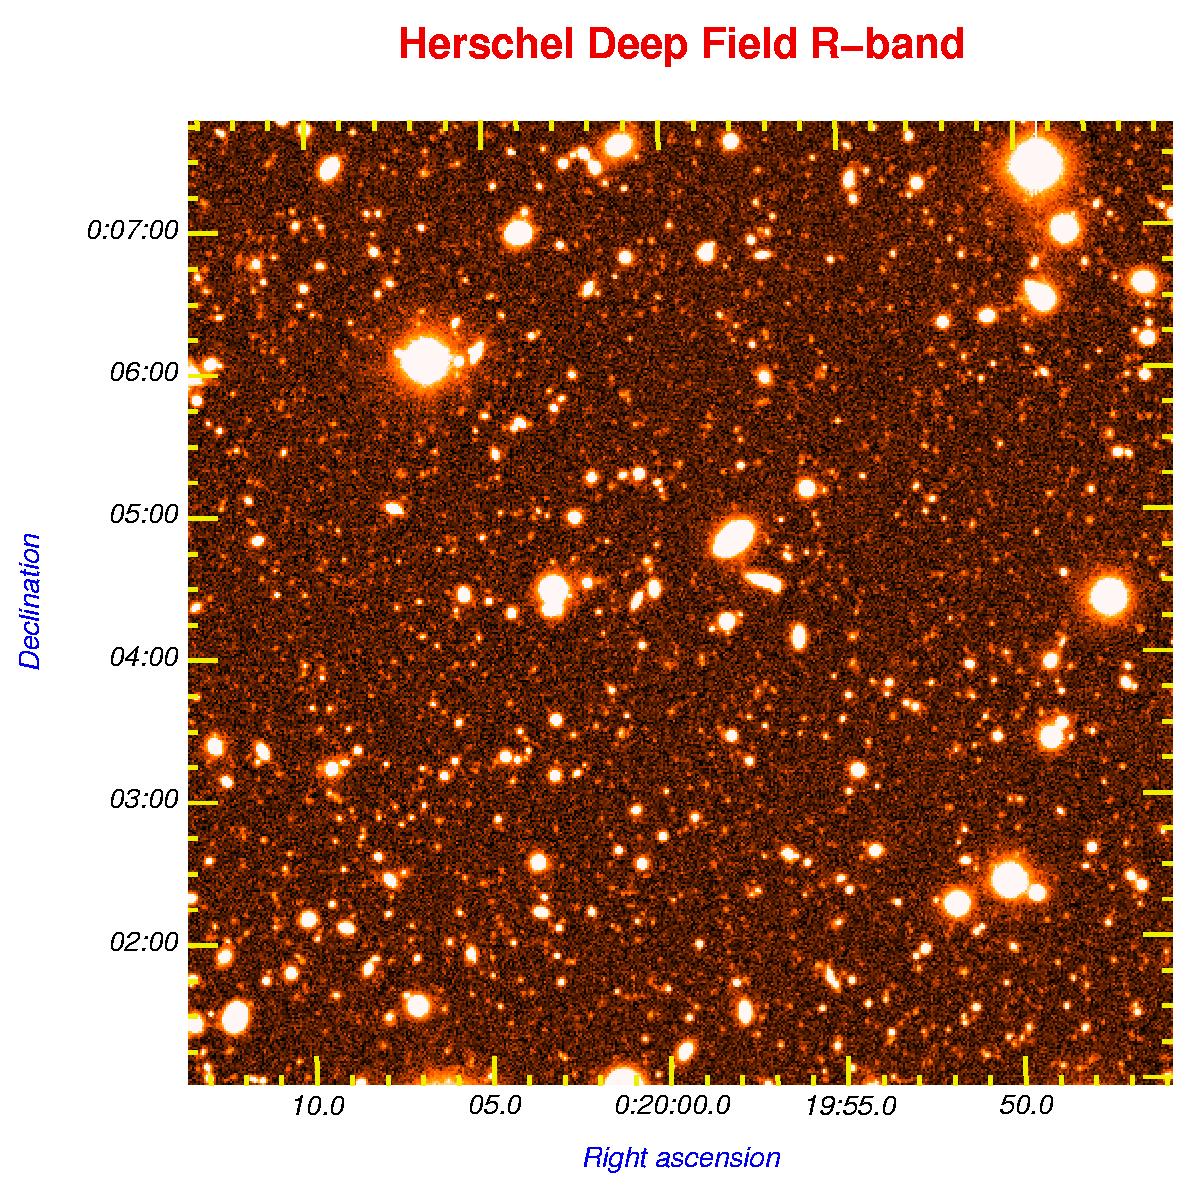
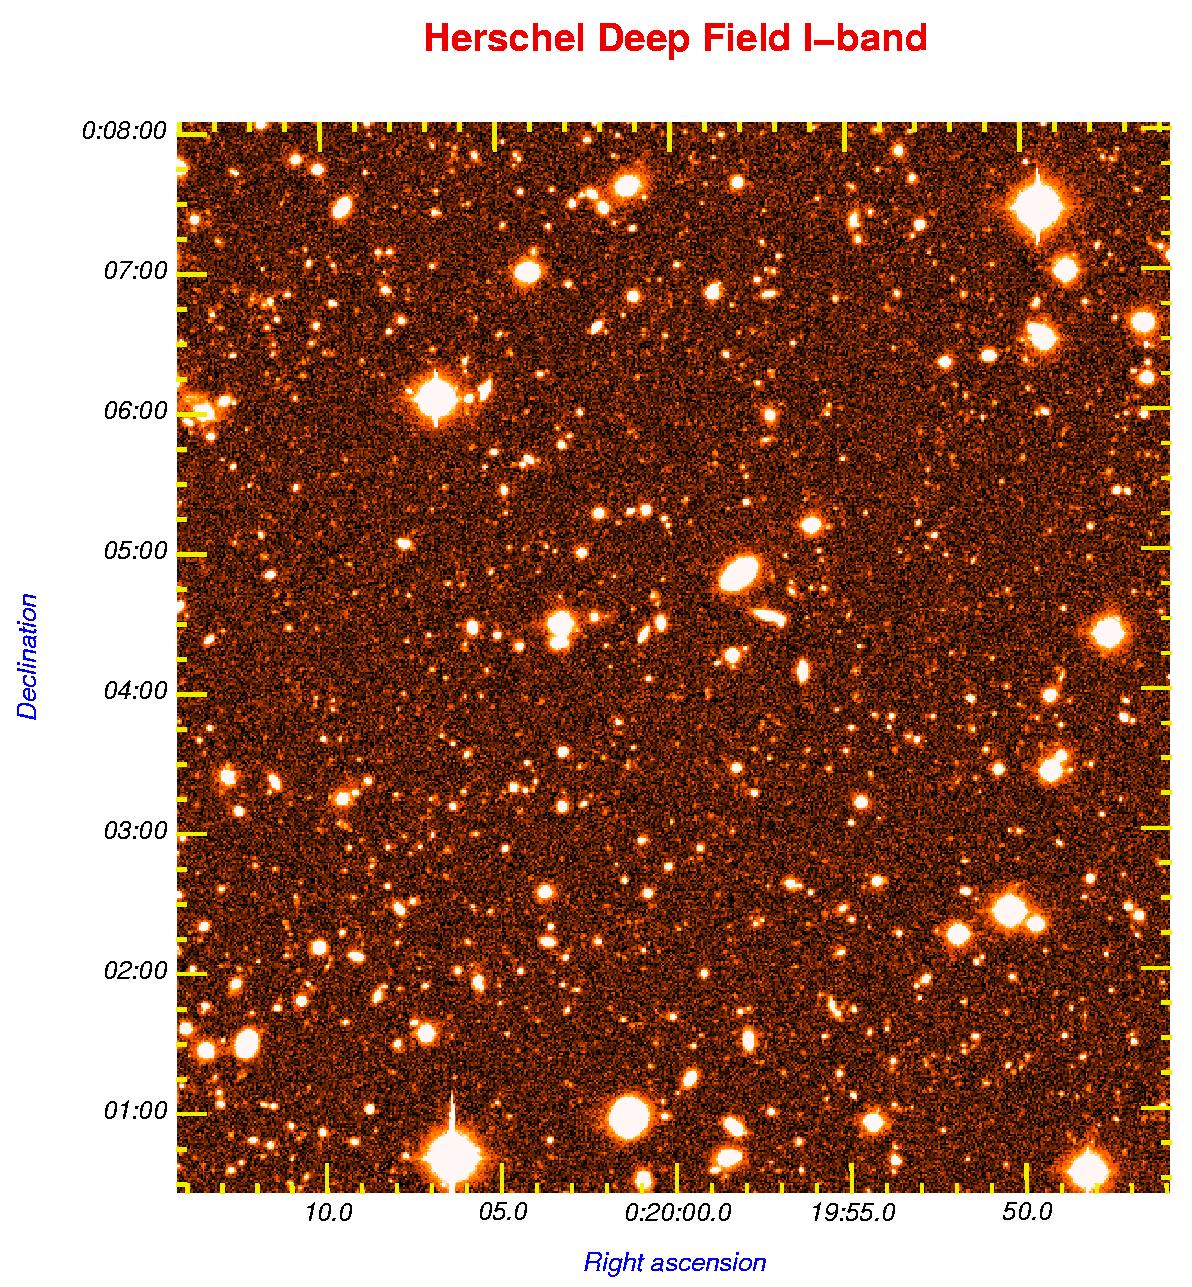
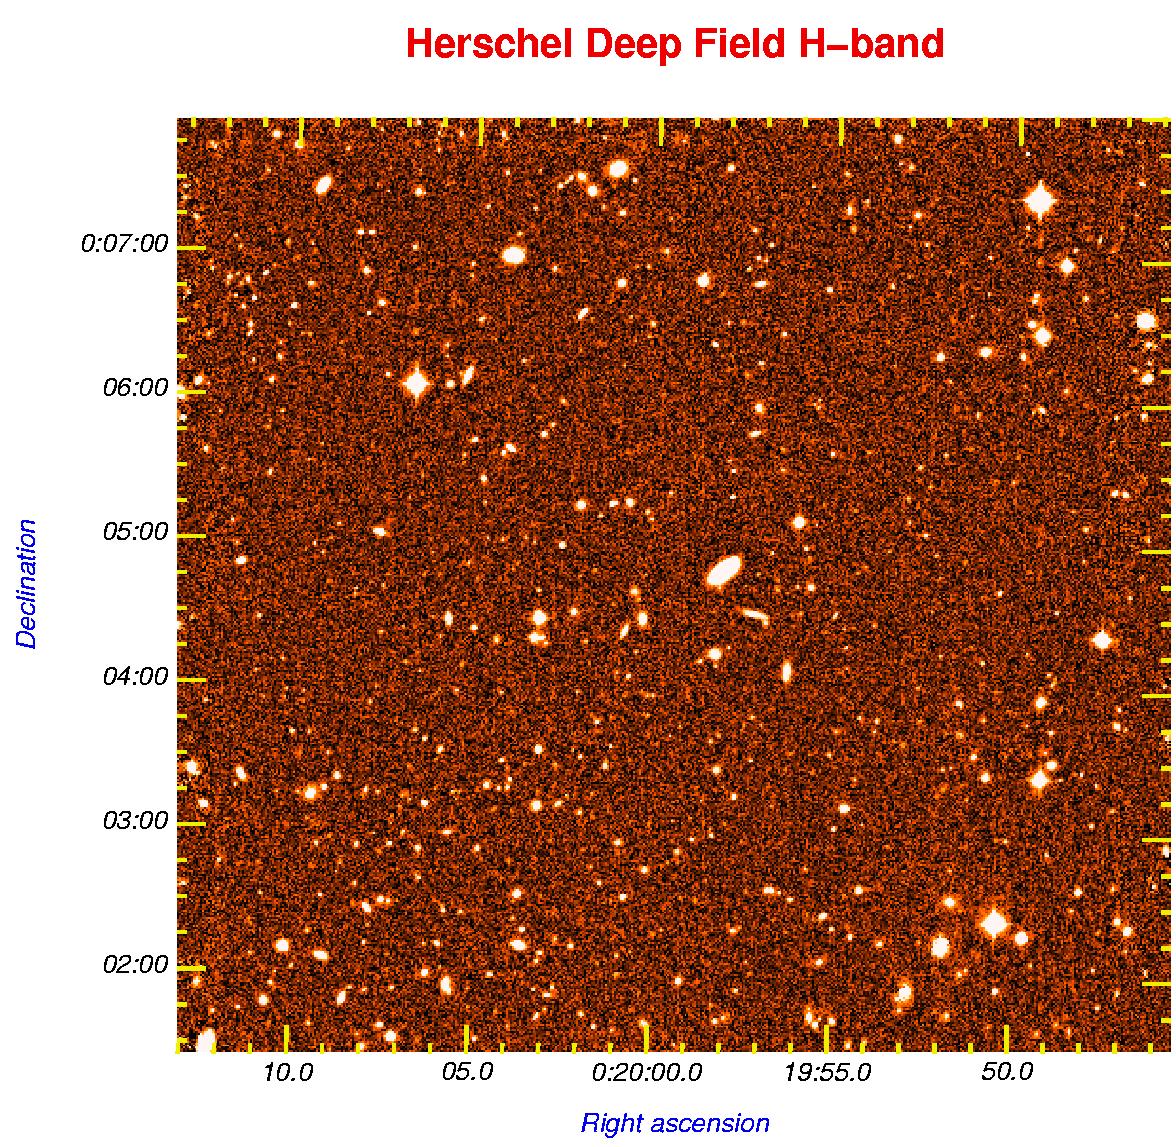
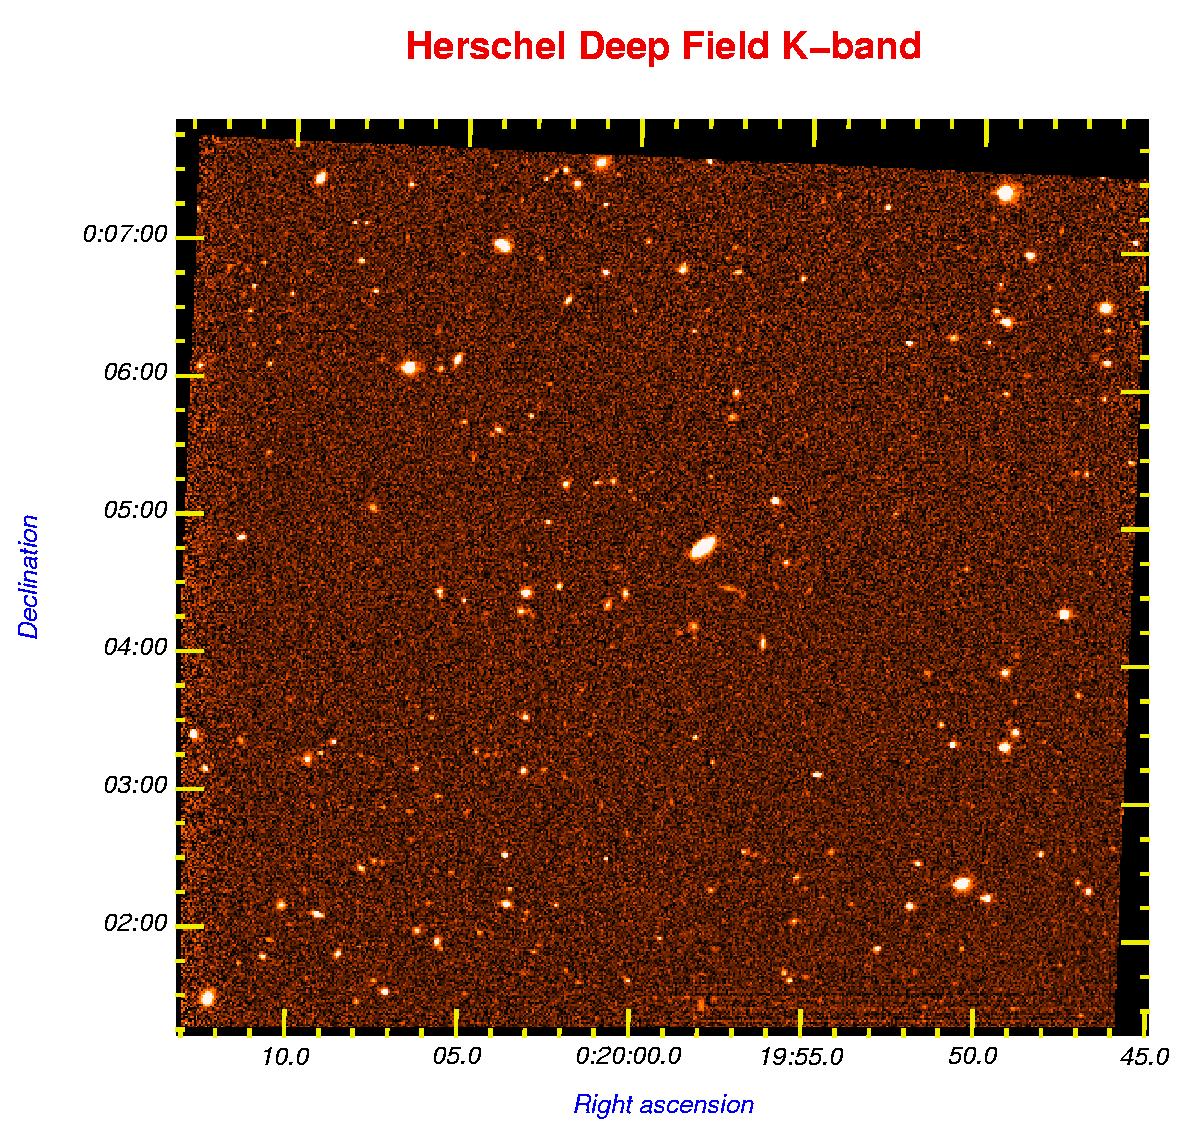
The William Herschel Deep Field is a 7x7 arcmin square patch of sky centred near 00h20m +00° which has been imaged from the ground in a variety of optical and near-IR bands.
Here are the papers describing the data in detail:
The exact centre of the B-band image is:
|
| |||||||||||||||||||||||||||||||||||||||||||||||||||||||||||||||||||||||||||||||||||
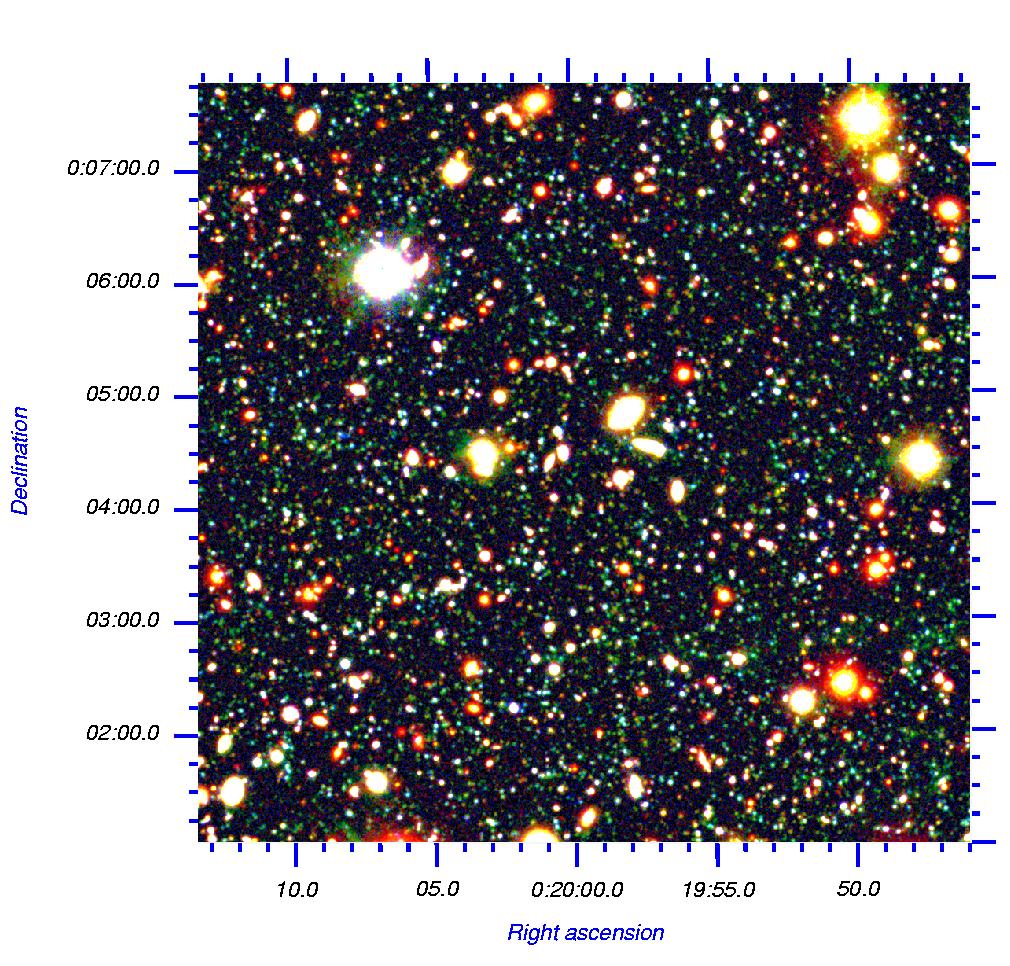
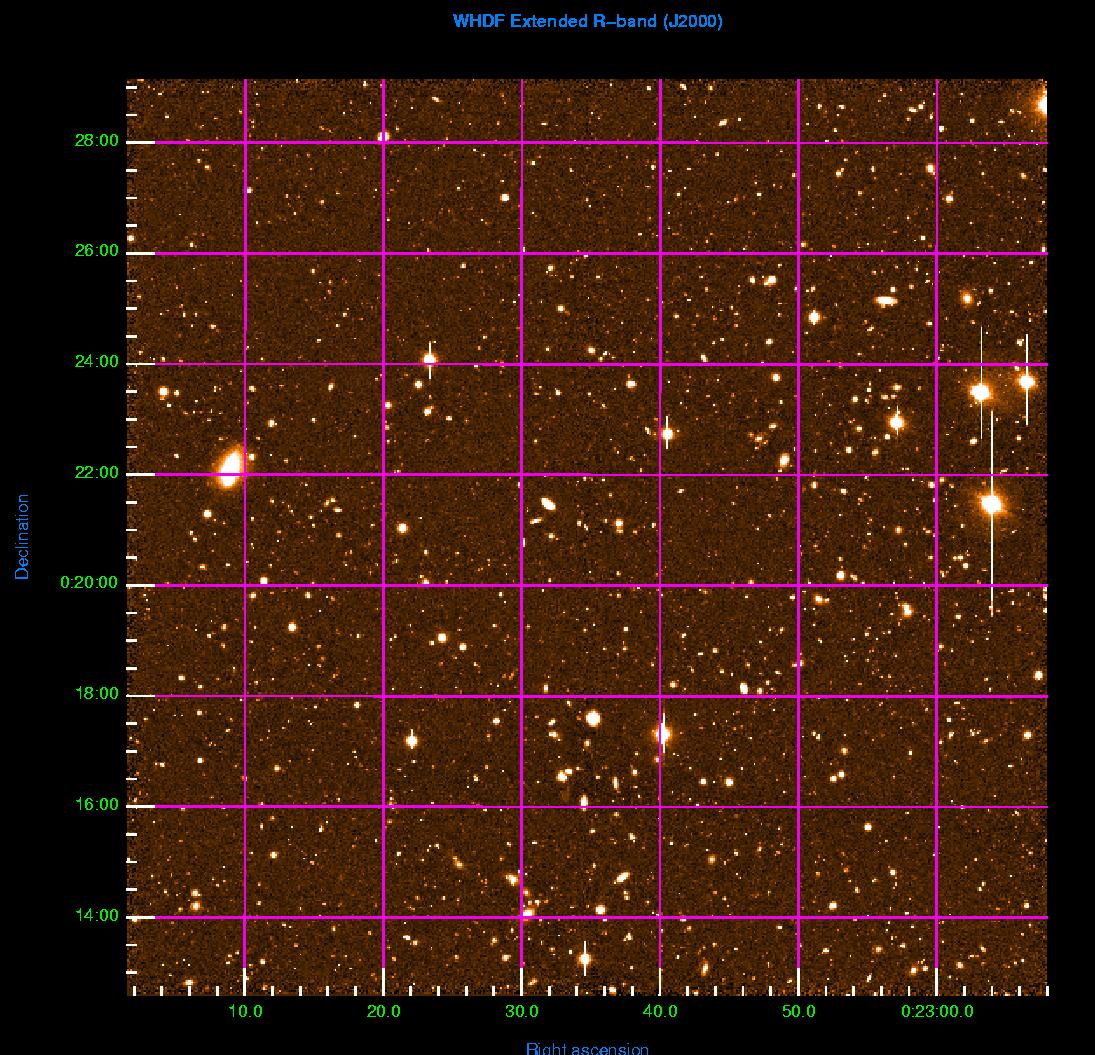
Here is a text file with the J2000 coordinates (fitted to USNO catalogue) of the R-selected sample (includes stars). There is now an image of the R-band with J2000 axes.
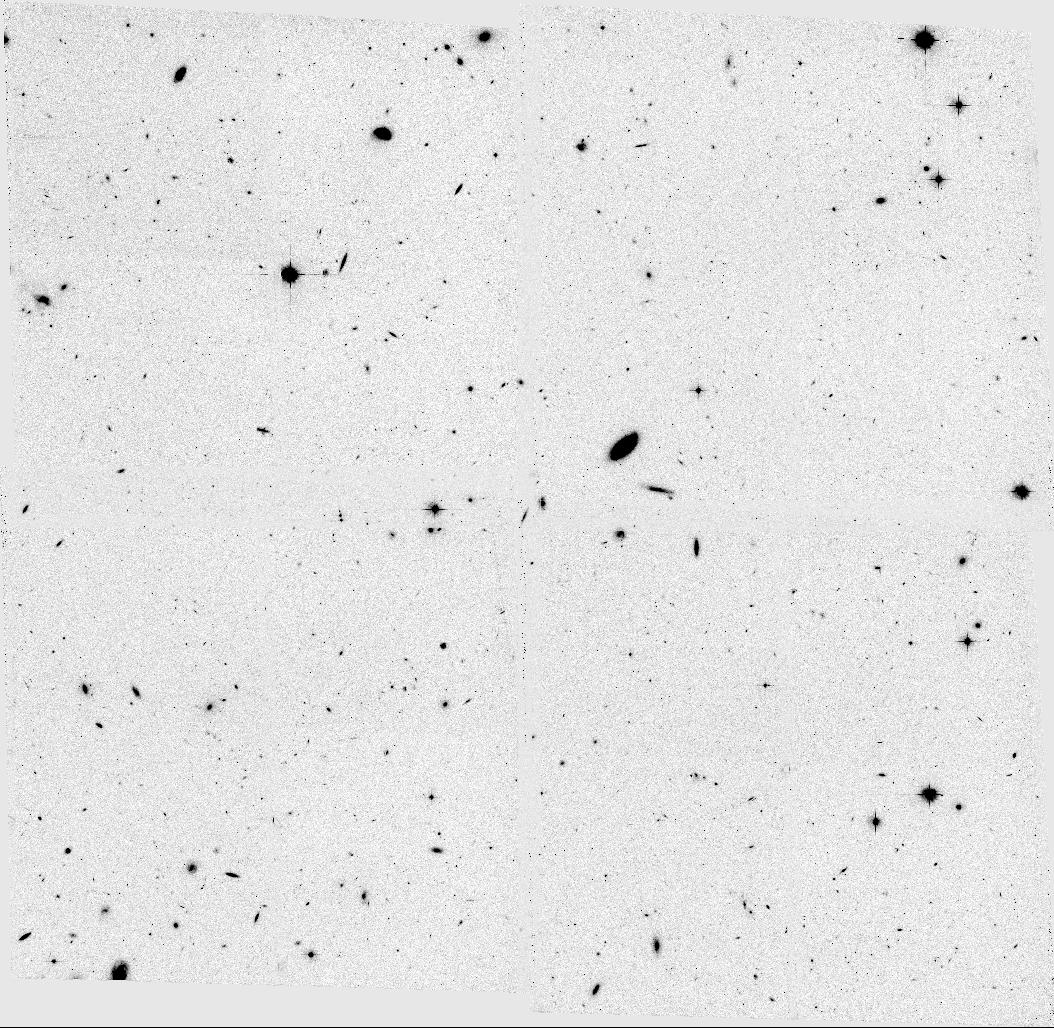
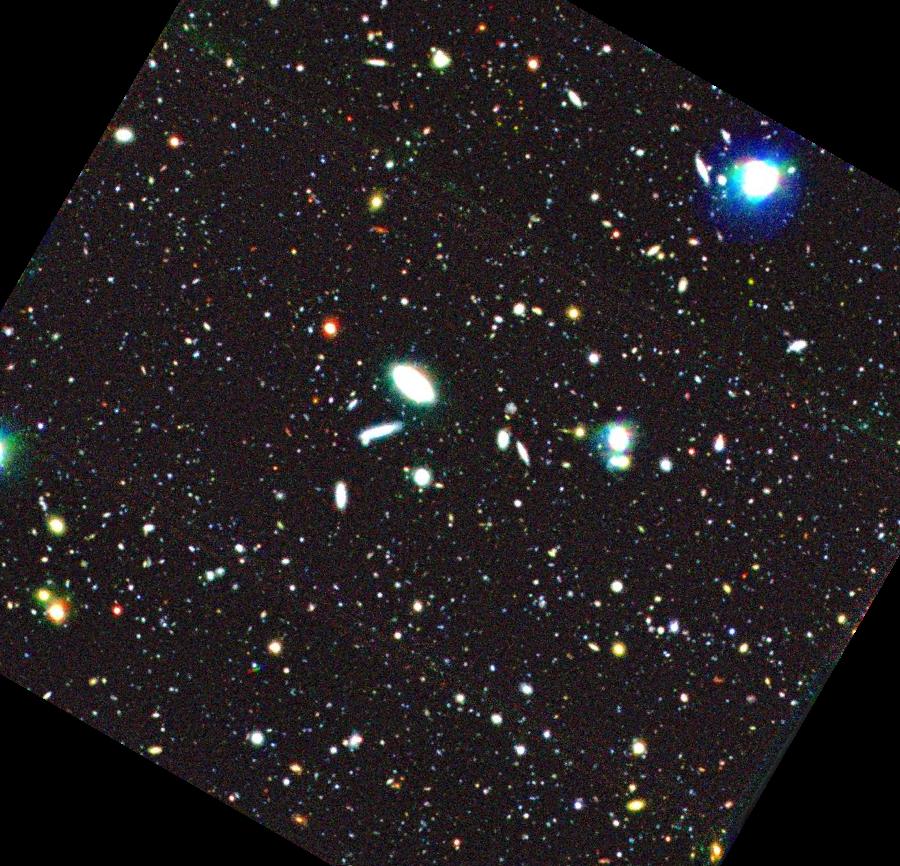 This is a true colour (gri) version of the Gemini field (rotated to have North at the top).
The extended field has UBRIZ and H coverage to at least 16'x16', centred on the original coordinates. It is not as deep, however.
You can interactively make plots of the WHDF extended data with the plotter.
R-selected image lists: total colours; aperture colours
Photometry Comparisons:
|
|
Here are true colour images of the extended WHDF:
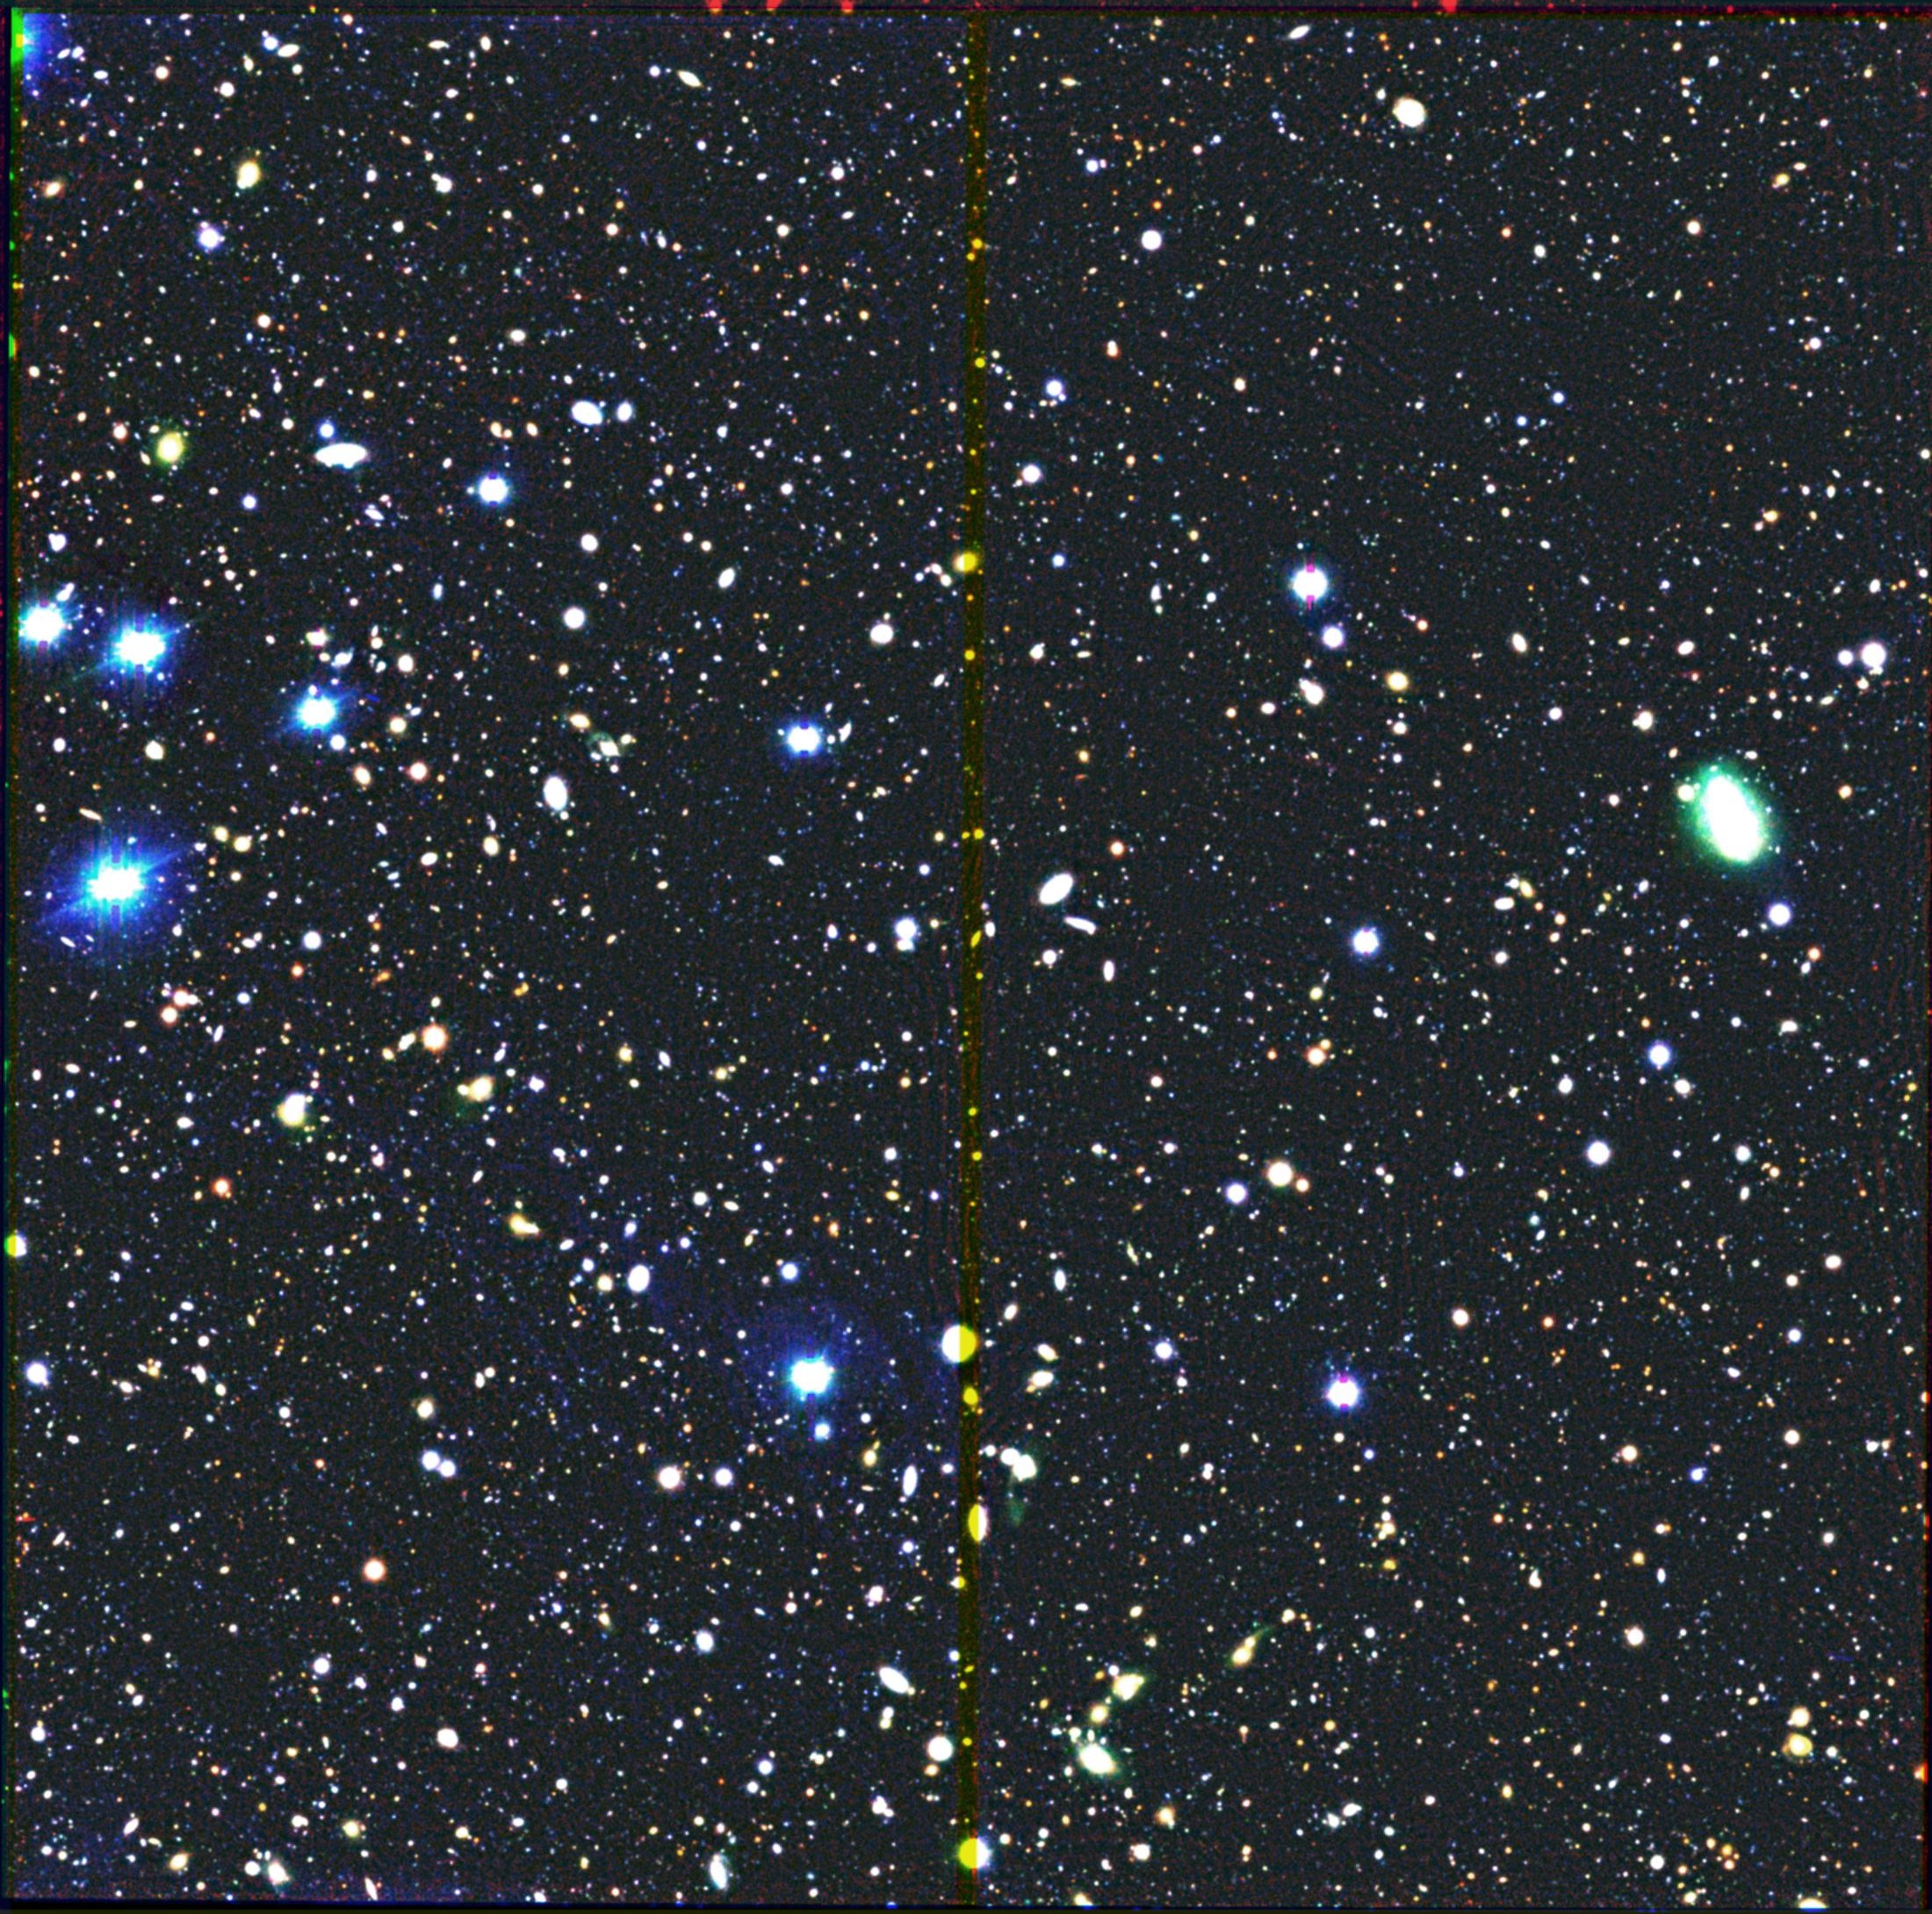 BRI image. |  RIH image. | 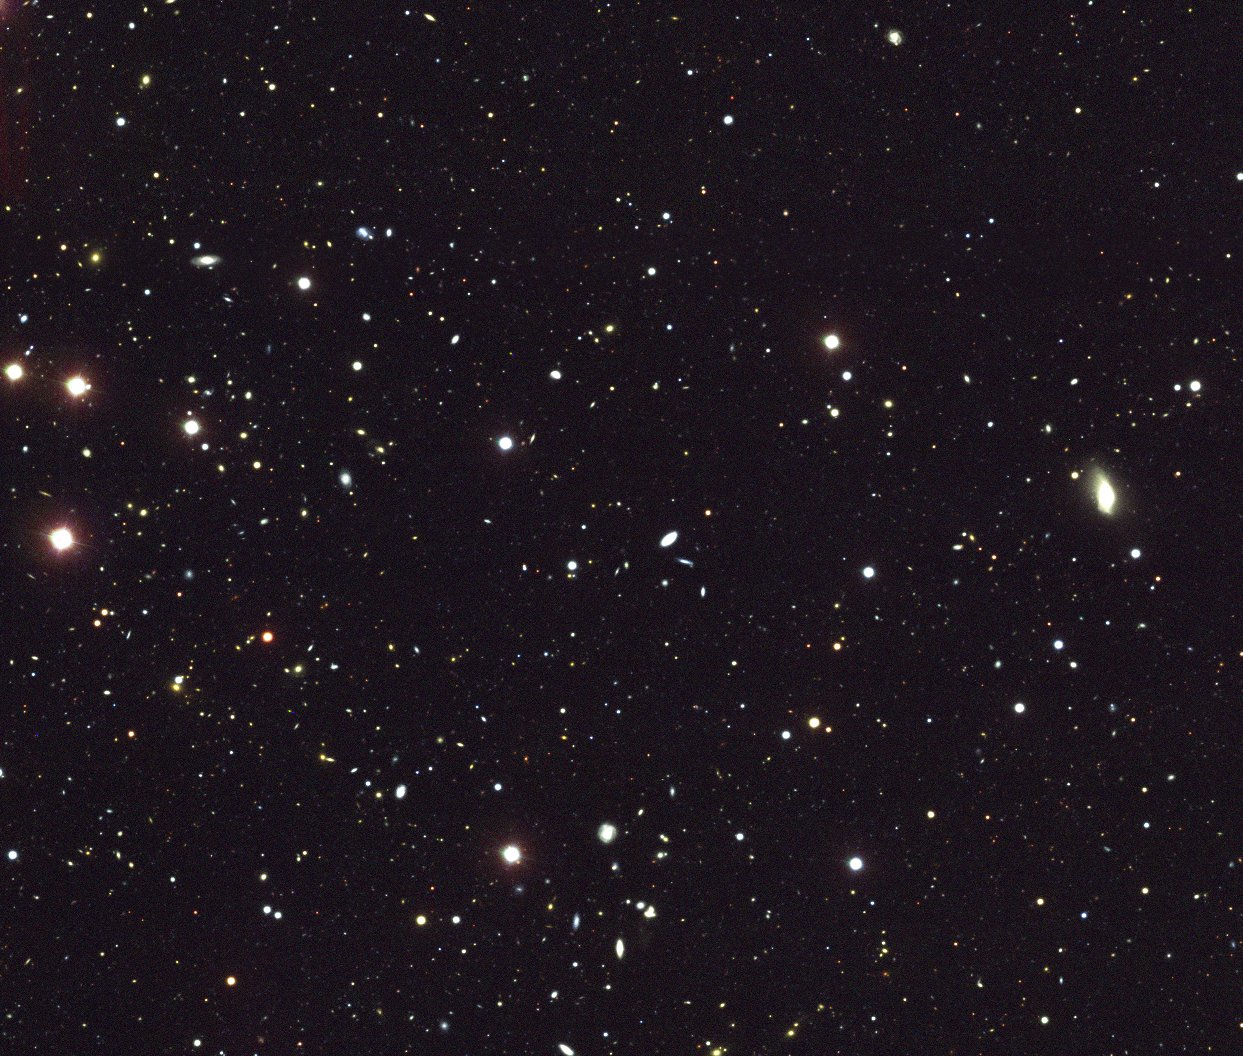 SDSS Stripe 82 gri. |
MOSCA target lists: These lists are for an ~11x11 arcmin area: Mask 1 Mask 2 Mask 3 Mask 4 |
Here is an ascii table of redshifts available on the extended WHDF field. These come from two runs of our own runs with LDSS2 on the Magellan 6.5m, and from FORS data taken by Bohm & Ziegler (2007, ApJ 668, 846). See also Fritz, Bohm & Ziegler (2009).
MOSCA spectra page - from Calar Alto, August 2008.
Optical snapshots of EVLA detections
Optical snapshots of Laboca detections
Last updated July 25th 2019 08:39:53. - nigel.metcalfe@durham.ac.uk

 Here is the 16'x16' 5hr R-band image
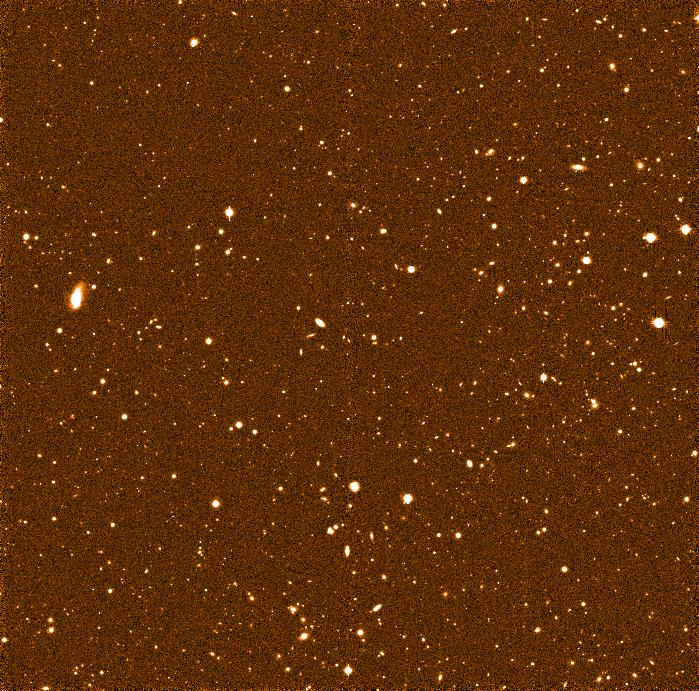 Here is the 16'x16' 1.3hr I-band image
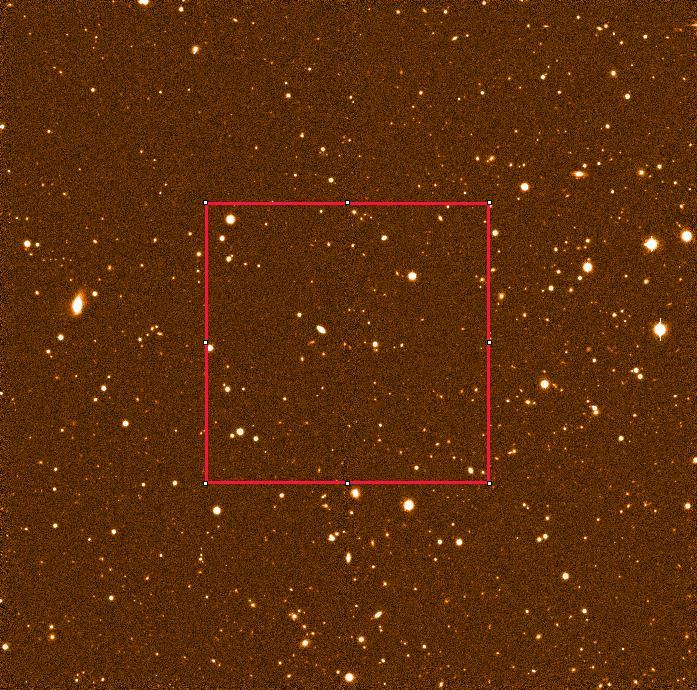 Here is the 16'x16' 4.5hr Z-band image