PISA - Position Intensity and Shape Analysis
PISA is a group of programs for automatically
detecting and measuring objects on an astronomical
image.
The main PISA program, PISAFIND, locates all the
objects on an image by detecting any regions of pixels
that are joined together, form a region greater than a
given size and that have intensities that are
significantly greater than the image background. Using
these criteria reduces the likelihood of making false
object detections. A set of parameters that quantify the
position, intensity and shape of each of these regions --
the "objects" -- are then calculated. Objects that
overlap with others (blends) can be separated out from
each other and estimates of the parameters of the
originals made.
The automated detection, deblending and
parameterisation of objects on images (from sources such
as small and large format CCDs and scanned photographic
plates) is useful when the numbers of objects become
quite large and the task of locating and measuring each
by hand isn't practical. Some areas of astronomy where
this is of particular use are the number counts of faint
galaxies and stars and the study of galaxy distributions,
however, automated measurement can also be of use in any
studies that need to relate the colour and magnitude of
many objects.
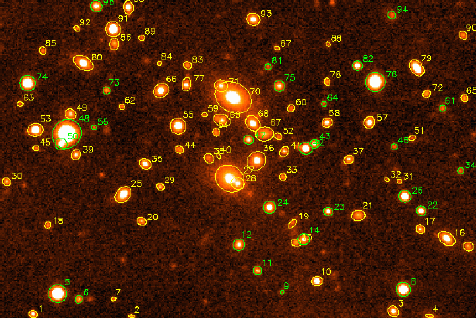
Figure 1: The results of a run of PISAFIND on an image
(the galaxy cluster 0637-53). Note how the plotted
objects are displayed overlaid on the image and how
merged objects have been separated.
PISA also helps to classify objects into different
astronomical types. This uses a "peakedness" estimate
(that indicates how like a star an object is) together
with other parameters that are intensity independent --
at least in principle. This explains why the objects
detected by PISAFIND are coloured differently above, cuts
in peakedness and ellipticity have been used to separate
out stellar (green) from non-stellar (yellow)
objects.
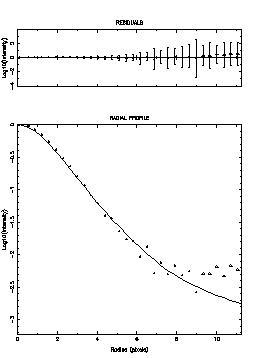
Figure 2: In addition to the detection mode shown in
Figure 1, PISAFIND can also use an analytic stellar
profile to fit stars. However, before this can be done
certain characteristics of the stars on the image must be
determined. This figure shows a fit of the analytic
profile to a selection of good stars on the frame. Using
a model fit is particularly useful when measuring
low-intensity stars as the some of the information
necessary for a good fit is already known (their
shape).
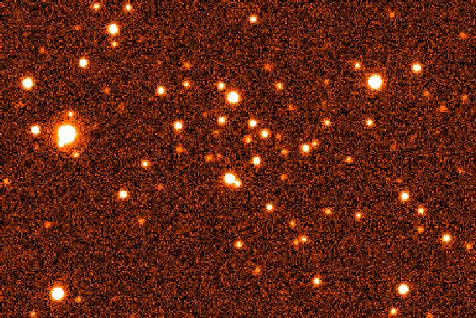
Figure 3: The results from PISAFIND can also be used
to generate model data to which noise can be added. This
is useful for testing purposes. The figure above shows a
false image generated from the data taken in Figure 1.
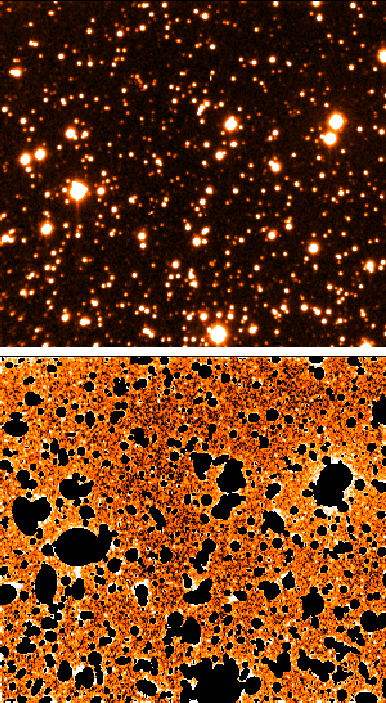
Figure 4: The objects detected by PISAFIND can be used
by other Starlink packages. In this example the regions
that the detected objects occupy have been removed using
the KAPPA program ARDMASK. This makes the completeness of
the detections obvious (840 where detected in this image,
using a 2.5 sigma threshold), and also makes clear the
flatness of the image background. This method could also
be used as a precursor to creating flatfields from
"dithered" images. The measurements made by PISA programs
can also be imported into the catalogue manipulation
package CURSA.
PISAFIND is based on the APM IMAGES program created by
Mike Irwin of the University of Cambridge. The PISA
package is fully described in
Starlink User Note 109.
|