Galaxy Biasing
In order to explore some of the uncertainty of the manner in which
galaxies trace the underlying mass distribution, for a a few of
our cosmological models, we have employed a variety of different
methods of selecting galaxies. Breifly these models are:
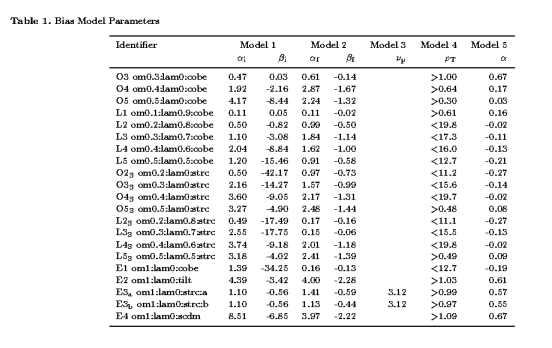
- 2-parameter exponential model based on the initial density field
- 2-parameter exponential model based on the final density field
- high peaks biasing
- sharp threshold in final density
- power law in final density
For more details see our
paper .
The single parameter biasing models are normalized to give
an rms fluctuation in r=8 Mpc/h spheres of 0.96 to match
that deduced for galaxies in the APM survey.
The two parameter models have their parameters chosen to fit
the APM rms flucuations in cubes of side 5 and 20 Mpc/h. Thus
where good fits are obtained these models reproduce both the
amplitude and slope of the correlation function for r<10 Mpc/h.
Table of Bias Model Parameters: (for better resolution click on the table)

Achieved Bias as a Function of Scale
The following figures show for each one of our simulations
the bias computed from the ratio
of the galaxy and mass power spectra as a function of wavenumber
k for each of our biasing algorithms.
- Figure Bias Model 1
- Figure Bias Model 2
- Figure Bias Model 3
- Figure Bias Model 4
- Figure Bias Model 5
Galaxy Density versus Mass Density
The correlation between galaxy density and underlying mass density
for each bias model and each simulation.
- Figure Bias Model 1
- Figure Bias Model 2
- Figure Bias Model 3
- Figure Bias Model 4
- Figure Bias Model 5

