|
In release version 3 the cube handling toolbox has been considerably
enhanced. It is now much faster at moving between slices, handles FITS
cubes as well as NDFs, and now features an all new, built-in, real-time
interactive spectral extraction display, which provides point and region
extraction.
It also has new controls for creating channel map images and selecting
ranges for baseline subtraction. On 64bit platforms cubes greater than
2Gb can be handled.
As part of these cube handling updates, all the image analysis toolboxes
now also work on cube slices and spectral analysis features are provided
by communication with SPLAT-VO, which works outside of GAIA.
Displaying slices from cubes
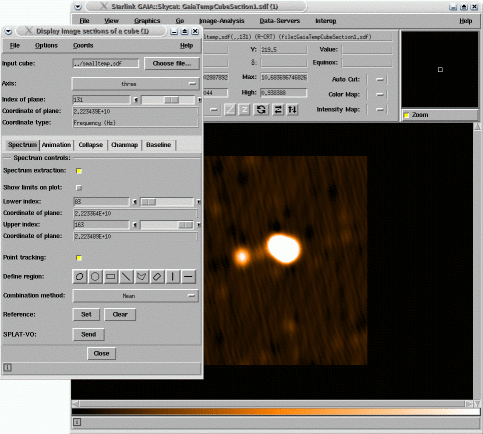
In this image you can see the new style cube handling toolbox. Movement
through the cube planes can be done by dragging the
Index of plane: control. The world coordinate of the plane is
displayed in the Coordinate of plane: label and its units in the
Coordinate type: label.
You can also view the cube from the perspective of other sides by
selecting a new Axis:. By default the third axis is assumed to be
the spectral one.
Spectral extraction
To extract a spectrum from a cube you just click on the image plane. To
move around the cube just drag over the image. Note that to change the
displayed range you need to click again as during dragging the range is
fixed to that of the first spectrum extracted.
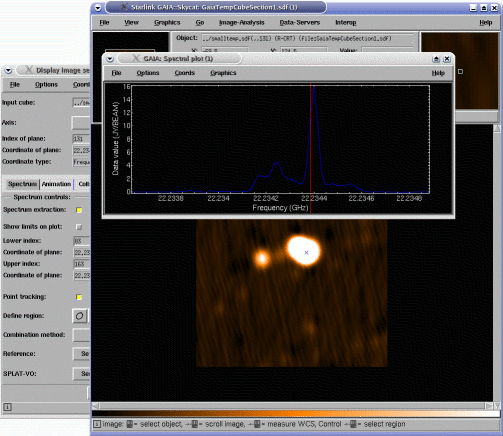
In this image you can see a spectrum extracted from the cube at the
position indicated by the blue cross. The coordinate of the currently
extracted plane is indicated in the spectral plot by the vertical red
line. You can drag on the red line to move image planes.
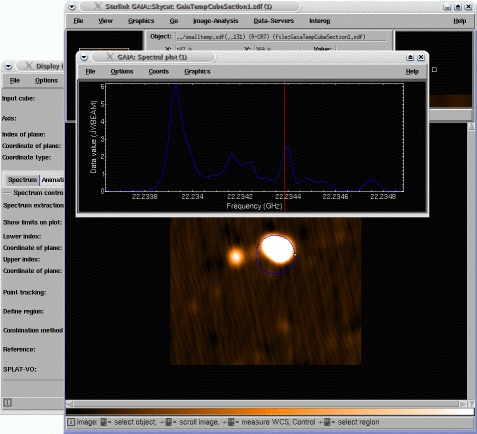
Spectra can also be extracted over regions. To create a region just
press one of the shape buttons and drag out the region on the image. The
region can be selected, resized and moved. In this image a circular
region is being used.
Spectral comparison
It is possible to compare one spectrum with another.
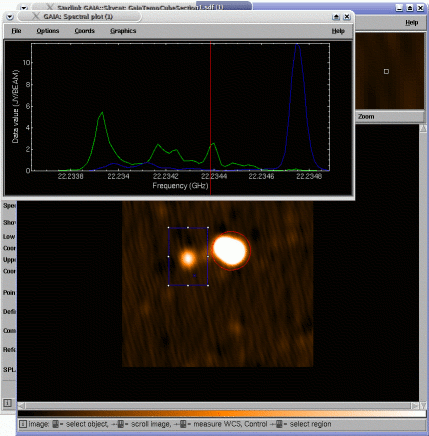
To do this extract a spectrum and then press the Set button in
the Reference: line. Now extract another spectrum and the
previous one will be shown in green (you will not see this until you
extract a new spectrum). In the image above two regions have been used,
one to define the reference and one the extraction. To get rid of the
reference spectrum press the Clear button.
Changing the spectral coordinates
It is possible to change between many different types of spectral
coordinate system (in fact most of those defined in FITS paper III),
provided your cube has a calibration. To do this just select the
required system in one of the Coords: menus. If you have a rest
frequency defined then you can move to velocities from frequency or
wavelength.
Animating through a range of slices
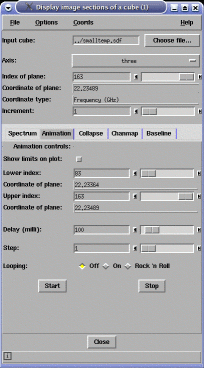
Using the control in the Animate tab you can automatically step
through a range of image planes. At the end of the range you can choose
to either stop, continuously start again from the beginning, or
continuously reverse direction (Rock 'n Roll).
Integrated intensity images
You can integrate the planes of a cube in various ways to produce
images. This is all done using the Collapse tab. It's called
Collapse as it's really just a front end to the KAPPA application
COLLAPSE, that you can run from the command-line (/shells).
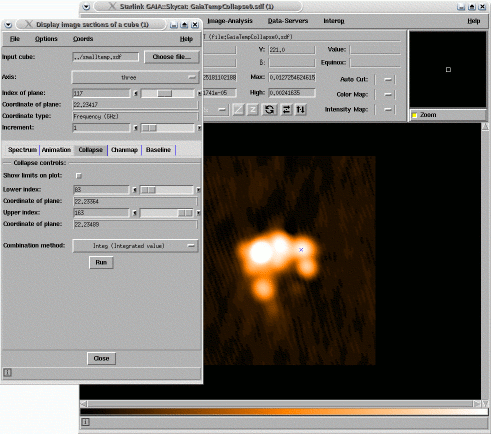
This image shows the integrated intensity of the whole cube. It's
possible to select a range to collapse. Other combination methods are:
- Mean - Mean value
- WMean - Weighted mean in which each data value is weighted
by the reciprocal of the associated variance.
- Mode - Modal value
- Median - Median value. Note that this is extremely memory
and CPU intensive for large datasets; use with care!
- Absdev - Mean absolute deviation from the unweighted
mean.
- Comax - Co-ordinate of the maximum value.
- Comin - Co-ordinate of the minimum value.
- Integ - Integrated value, being the sum of the products of
the value and pixel width in world co-ordinates.
- Iwc - Intensity-weighted co-ordinate, being the sum of
each value times its co-ordinate, all divided by the integrated value
(see the Integ option).
- Iwd - Intensity-weighted dispersion of the co-ordinate,
normalised like Iwc by the integrated value.
- Max - Maximum value.
- Min - Minimum value.
- Rms - Root-mean-square value.
- Sigma - Standard deviation about the unweighted mean.
- Sum - The total value.
Channel maps
Using the Chanmap controls you can create a "Channel map"
image of the cube. A channel map image is like a collapsed one, except
that the spectral dimension is divided into a number of ranges and each
of these is collapsed images is added to the result in a grid
arrangement.
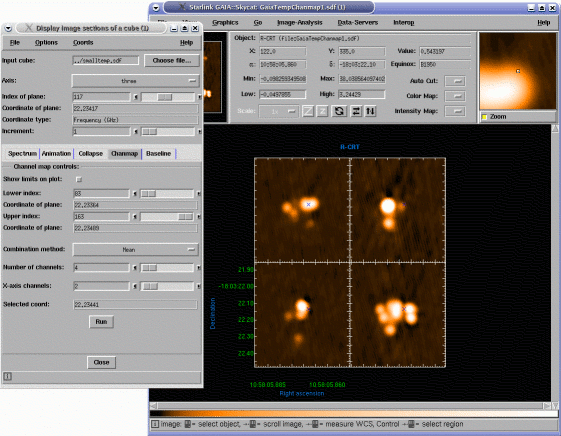
The image above shows a cube that has been collapsed into four
ranges. So each channel map is representative of a range of spectral
values. As you can see a channel map can have a special grid overlaid
(see the Image-Analysis->Overlay axes grid... toolbox) and when
you click on one pane the corresponding positions in the other panes is
identified and the mean spectral coordinate used in that pane is
displayed in the Selected coord: label.
Baseline subtraction
These controls run the KAPPA application MFITTREND to fit and subtract
baselines from each spectrum in the cube. The baseline is estimated as a
polynomial fit, of the selected order. Each spectrum is fitted
independently and the data selected for each fit can include up to four
ranges along the spectral axis.
Analysing spectra
GAIA doesn't provide any analysis functions. It concentrates on
inspection. So to analyse spectra you can save them to disk file (see
the File menu item in a spectral plot), or more conveniently
you can send them to the SPLAT-VO application by pressing the
Send button in the SPLAT-VO: controls. It is also possible
to send spectra to other PLASTIC-enabled applications.
Operations supported on image slices
The image slices can be analysed by any of the usual toolboxes, such as
regions statistics and aperture photometry. The only restriction is that
the slices are temporary files so will be deleted when GAIA exits (or
sooner).
Data formats and efficiency
The toolbox should handle both NDF and FITS data cubes with more-or-less
equal efficiency, except for the Collapse, Chanmap and
Baseline operations. In this case the FITS cube will be converted
into an NDF first, so clearly it would be better to convert to NDF
format first.
Normally the cube file is memory mapped to access the data. Usually this
gives a good compromise between startup speed and access speed. However,
for very large cubes (2Gb and up) the access speed can suffer as the
data is only read incrementally on demand. This is particularly
noticeable when plotting spectra (which are usually accessed sparsely in
the third dimension), typically this manifests itself as a very slow
response, which suddenly becomes much faster after clicking on the cube
many times. To avoid this behaviour you can choose to read the cube into
core memory (but make sure you have sufficient first), in one chunk. To
do this select the Memory map cube data option in the
Options menu (and wait a while).
|