|
To complement the already powerful data cube handling facilities of the
Starlink GAIA application it has been extended to provide integrated 3D
volume and iso-surface rendering.
The result is a simple integrated system with support for astronomy data
formats and coordinate systems that limits the initial knowledge
necessary to exploit 3D visualisation for data exploration and
analysis.
Iso-surfaces

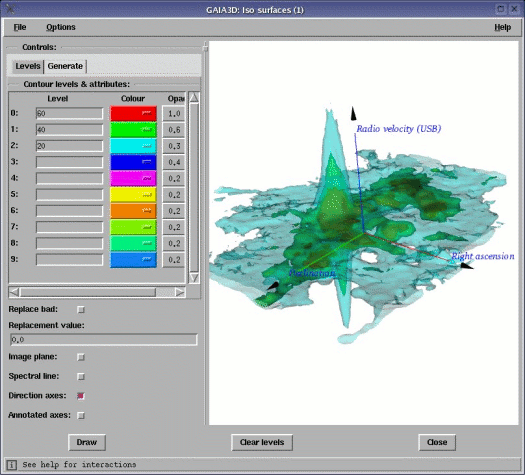
This picture shows the new GAIA toolbox displaying a JCMT dataset (of
the central parts of the Orion nebula) using isophotal contours at
various levels and with various opacities to render the volume (using
opacities allows you to see different depths within the outer
volumes). A number of levels can be automatically suggested (based on
the data displayed in the main GAIA window), or chosen to give
logarithmic intervals. The data can be directly shared with GAIA, unless
replacement of bad values is required. This isn't usually the case for
contouring. Interaction with the image uses a series of mouse gestures,
or the keyboard can be used for finer control. The cardinal directions
of the data's world coordinates (in this case RA, Dec and Radio
velocity) can be permanently displayed in the current view.
Volume rendering

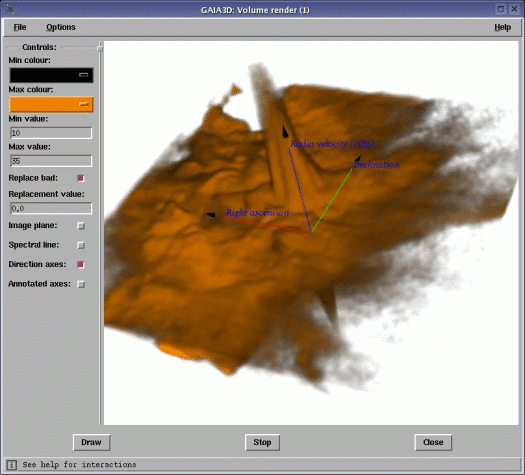
Picture showing volume rendering of the same dataset as above. The
colour transfer function is a simple mapping between two selected
colours for the given data range. Volume rendering is sensitive to the
presence of bad data values, so any blank values have been replaced with
the value zero.
Interaction with GAIA

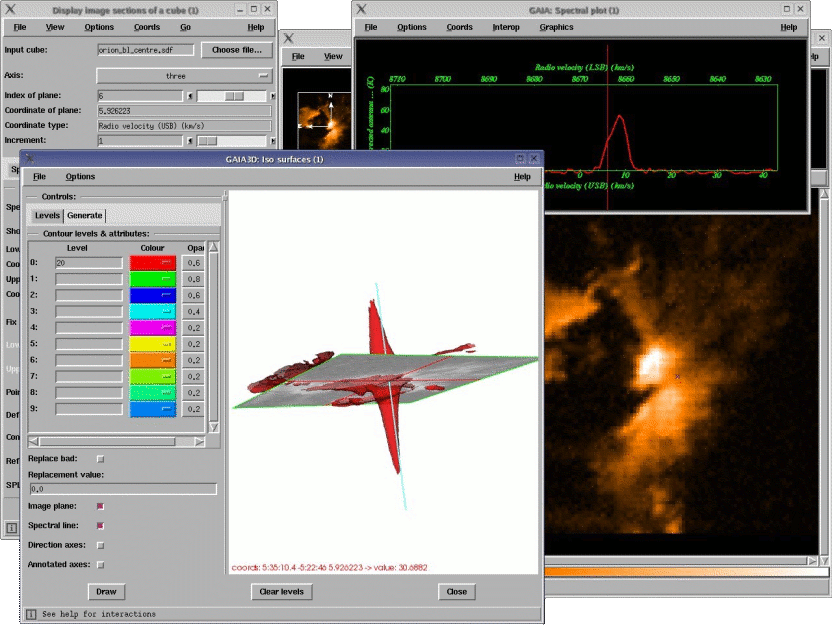
GAIA currently provides facilities for displaying slices from cubes, and
extracting a point spectrum. These positions within the data-cube can
now be visualised as a plane and a line. The positions of the plane and
spectrum can be changed using GAIA in its traditional mode, or you can
now move the plane and spectral line around within the visualised
volume. When dragging over the plane a readout of the coordinates (RA,
Dec and Radio velocity in this case) is provided, as well as the data
value.
Annotated axes

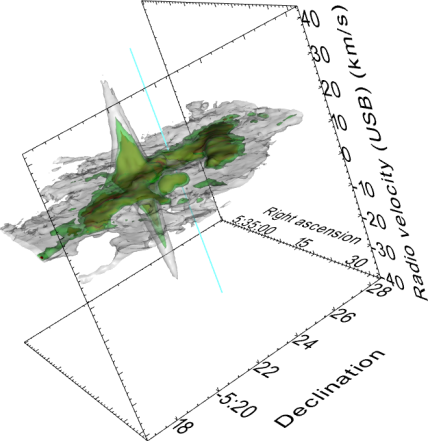
Using the new Plot3D facilities of the AST library, annotated axes
displaying labels in familiar sexagesimal formatting can also be
displayed. In the picture above you can see one possible way of
displaying these shown in a print, rather than a screen capture.
|