|
The CUPID package (SUN/255) provides a set of tools for identifying and
analyzing clumps of emission within 1, 2 or 3D data arrays. It is used
to produce some of the advanced data products in the JCMT Science
Archive (JSA) for the data-cubes created by HARP/ACSIS and will also
do so for the images created by SCUBA-2.
GAIA provides methods to view the clump catalogues and
pixel masks that identify the clumps in 2 and 3D. Handling these data
types is shown here.
Displaying 2D clump catalogues
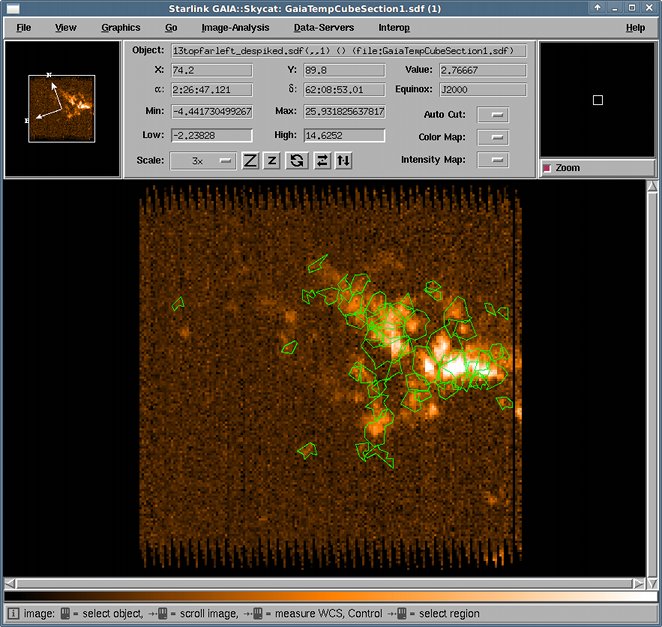
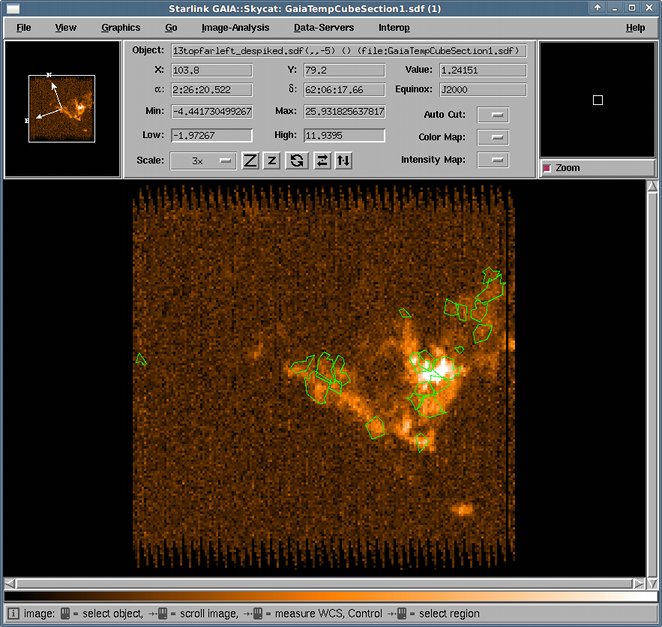
2D clumps catalogues from a run of CUPID FINDCLUMPS, or downloaded from the
JSA, can be opened using the Data-Servers->Local Catalogs dialog. Once
opened their coordinates will be matched to those of the displayed image and
the STC-S descriptions of the polygons associated with differing parts of the
analyzed image will be displayed.
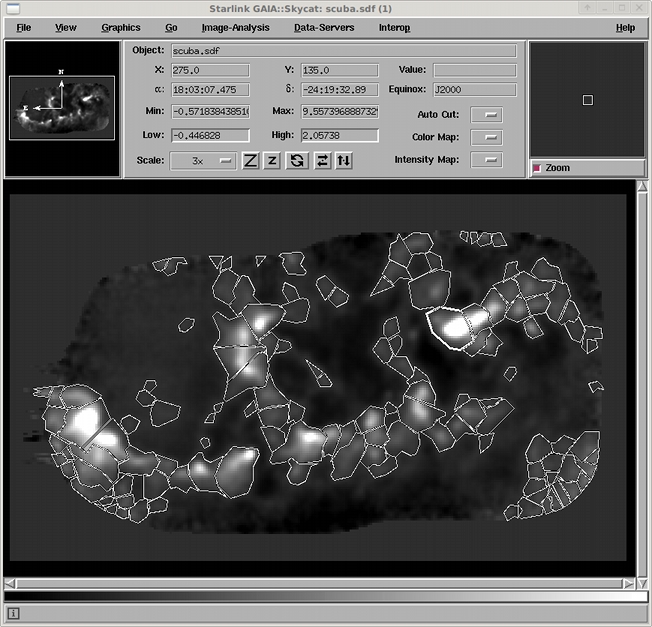
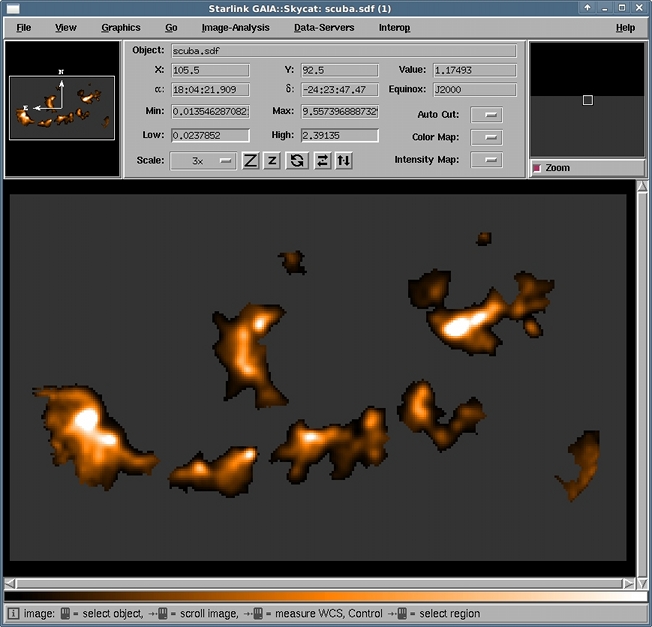
Image displaying a clump catalogue over the image used for the detections.
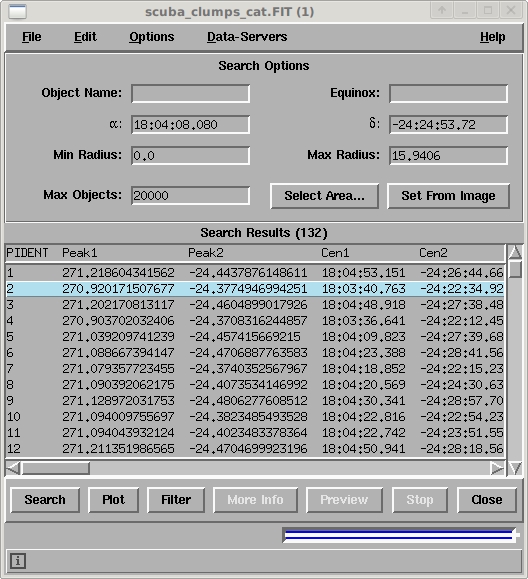
The catalogue itself.
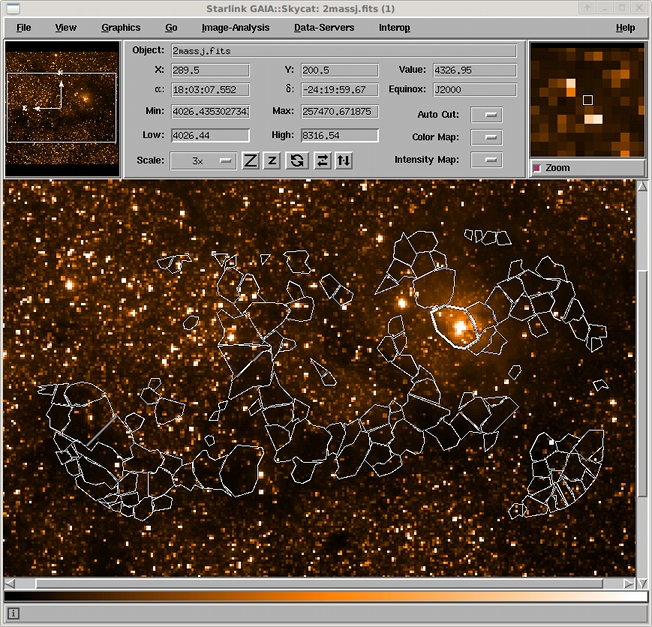
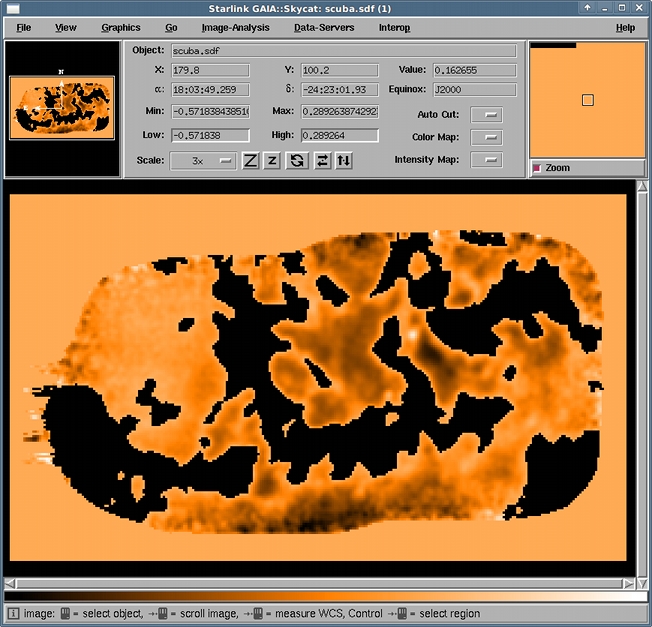
Image displaying a clump catalogue over a different image.
Displaying 2D clump masks
The actual pixels associated with a clump are recorded in an associated
mask. This can be viewed as a simple image, or you can view individual clumps
or ranges of clumps. To open a mask select the Image-Analysis->Mask
image toolbox and select the mask file.
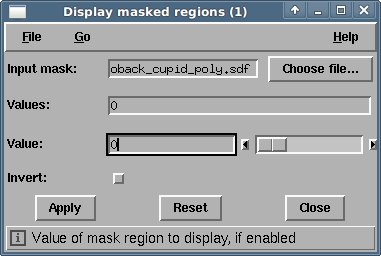
Probably the most useful thing to do first is see what didn't get put into a
clump. To do that select Invert: and press Apply.
Or as mentioned above you can view pieces or ranges of flux. Here the
range 1-50 was entered into the Values: field.
Displaying 3D catalogues
There are three ways to display a clump catalogue created from an ACSIS
data-cube. You can just open it as a 2D catalogue and all the positions on the
sky will be displayed as above, or you can open it using the View->Import
CUPID catalogue dialog which is in the cube toolbox (you open data cubes
using the File->Open cube dialog in the main window). Finally you can
view the catalogue rendered into 3D.
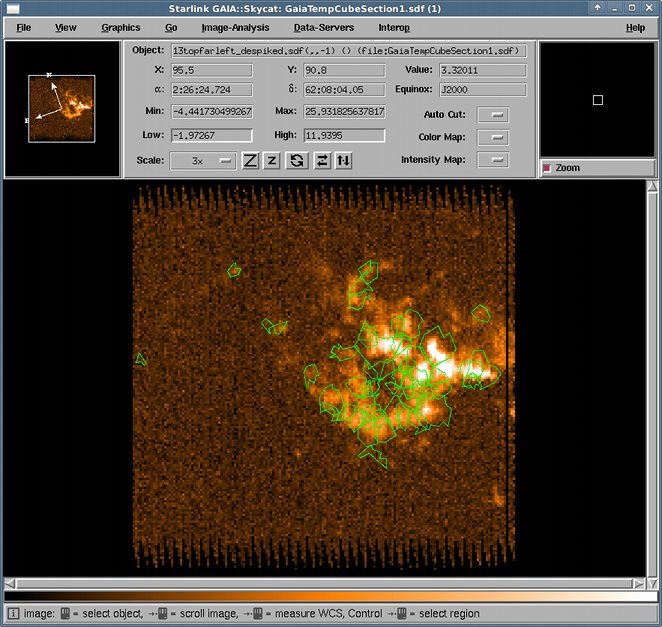
If you import the catalogue only those clumps which have emission in the
currently displayed slice will be shown. This will be updated as you move
through the cube.
To view a 3D rendering of the clumps, open the View->3D visualisation->Iso
surfaces toolbox. Choose the CUPID tab, select Display
catalogues. All that's needed now is to press Draw. Unless you
want to also see the cube in which case set some levels for contouring.
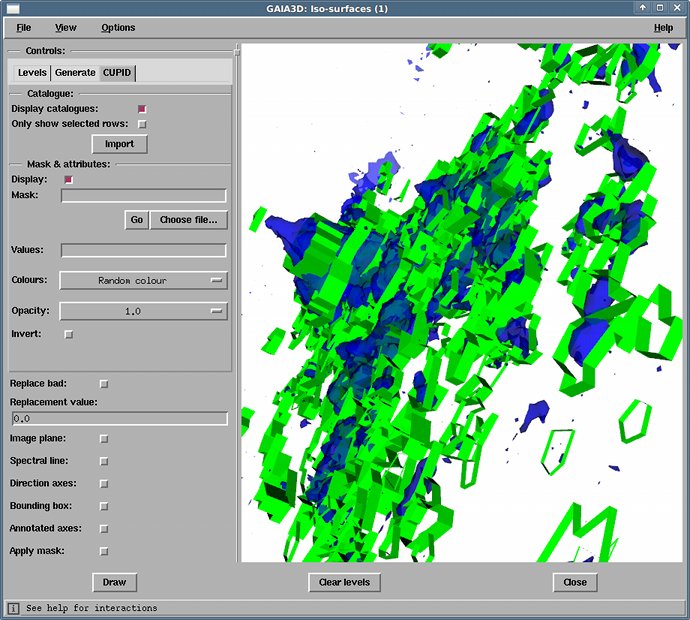
You can restrict the clumps displayed by selecting rows in the catalogue
window and setting the Only show selected rows option.
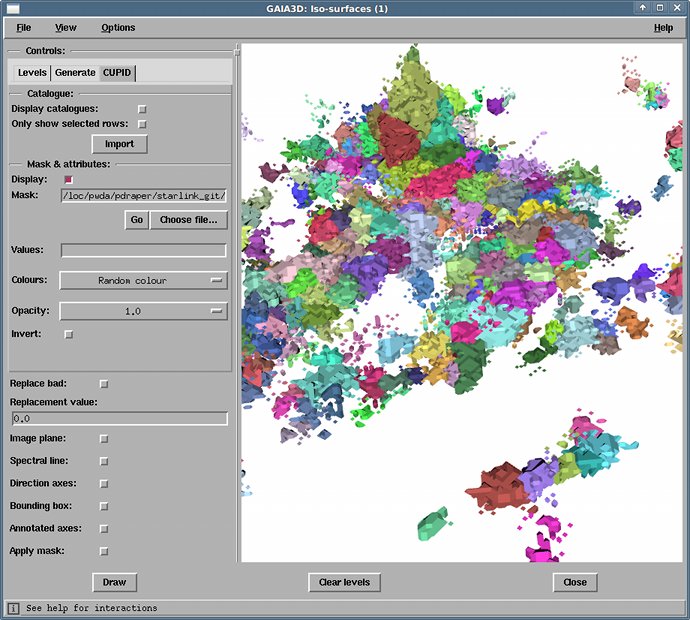
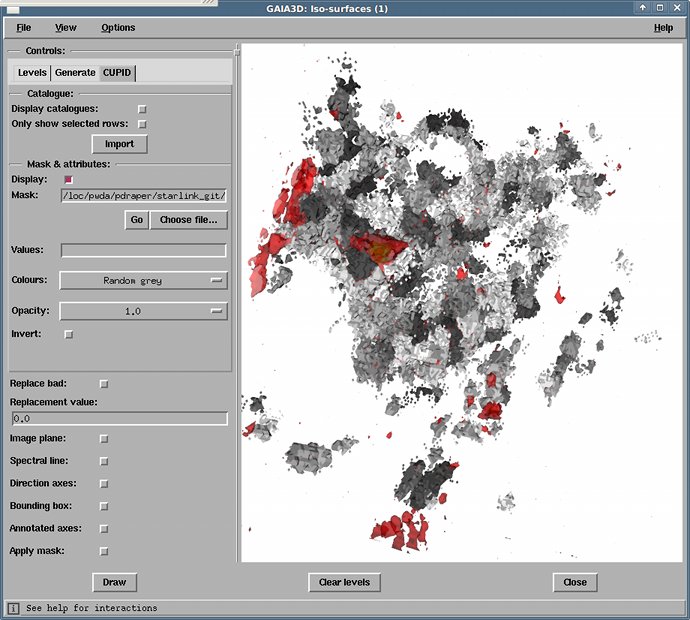
Displaying 3D clump masks
3D clump masks can only be visualised as a 3D rendering. To view one of these
just enter the file name in the Mask: field and press Draw
(no main data is necessary to do this).
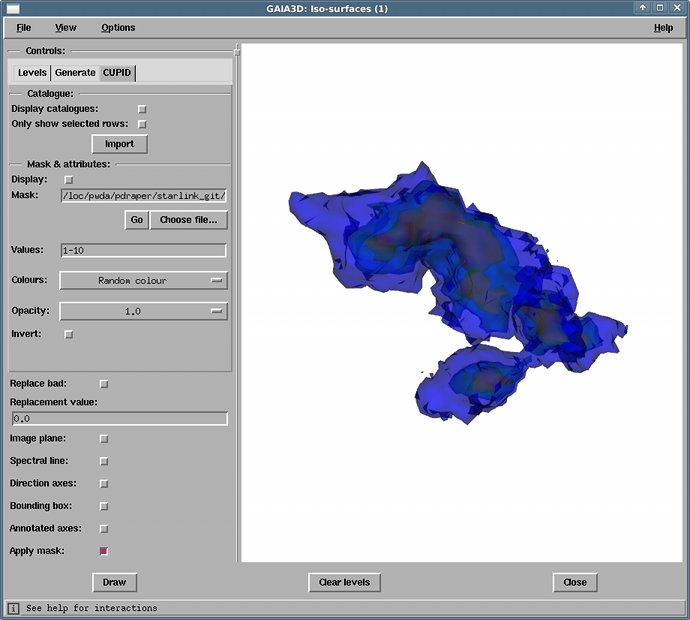
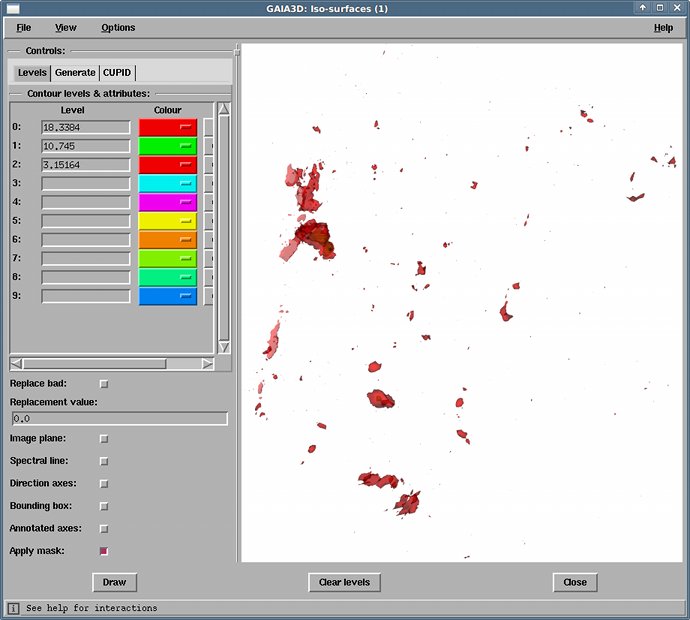
Masks can also be used to view the original flux, just tick Apply
mask: and untick Display: in the mask section. That will
only display flux associated with a clump. To see individual clumps enter some
indices in the Values: field. The below shows clumps 1 through 10
(you'll also need to define some levels this time, since we're back to looking
at the data).
You can also see the flux that didn't get used by inverting the mask
and applying that.
Although you could have seen that by drawing the mask and cube at the same
time (excluded flux in red).
|