The Solar System
The planetary science group within the ICC studies: the distribution of near-surface hydrogen/water ice on the Moon, Mars and Mercury; the consequences of giant planetary impacts with high resolution simulations; the lunar argon exosphere and its connection with potassium in the Moon; and the distribution of lunar thorium and what it tells us about the internal structure of the Moon.We use data from a variety of instruments and various analysis and modelling techniques: neutron spectroscopy, gamma-ray spectroscopy, synthetic aperture radar measurements, image reconstruction, Monte Carlo exospheric simulations and smooth particle hydrodynamical simulations.
| Simulation of a collision between the proto-Earth and a Mars-sized impactor. Different colours represent the iron core and rocky mantle of each body. After the collision, a Moon-like satellite with a small iron core is left in orbit around the Earth. | |
Video description: A smooth particle hydrodynamics (SPH) simulation showing a giant impact between the proto-Earth and a Mars-sized body. The iron cores (shown in one colour) and rocky mantles (shown in another) of each body are tracked through the collision. The simulation shows how the impact ejects material into orbit, eventually forming the Moon with a small iron core, consistent with lunar samples.
Planetary giant impacts. Using the SWIFT hydrodynamical simulation
code, we have studied the giant impact on the proto-Earth that is thought to
have formed the Moon, the even larger collision that may have knocked Uranus
over so that it spins on its side with an obliquity of 98°, and how
giant impacts erode atmospheres from Earth-like planets.
SWIFT has allowed us to use over a billion particles to model these
collisions in unprecedented detail. We have also developed the publicly
available WoMa and SEAGen python software to create low-noise particle
representations of the initial conditions for these simulations, including
spinning planetary bodies.
See http://icc.dur.ac.uk/giant_impacts for more animations and details.
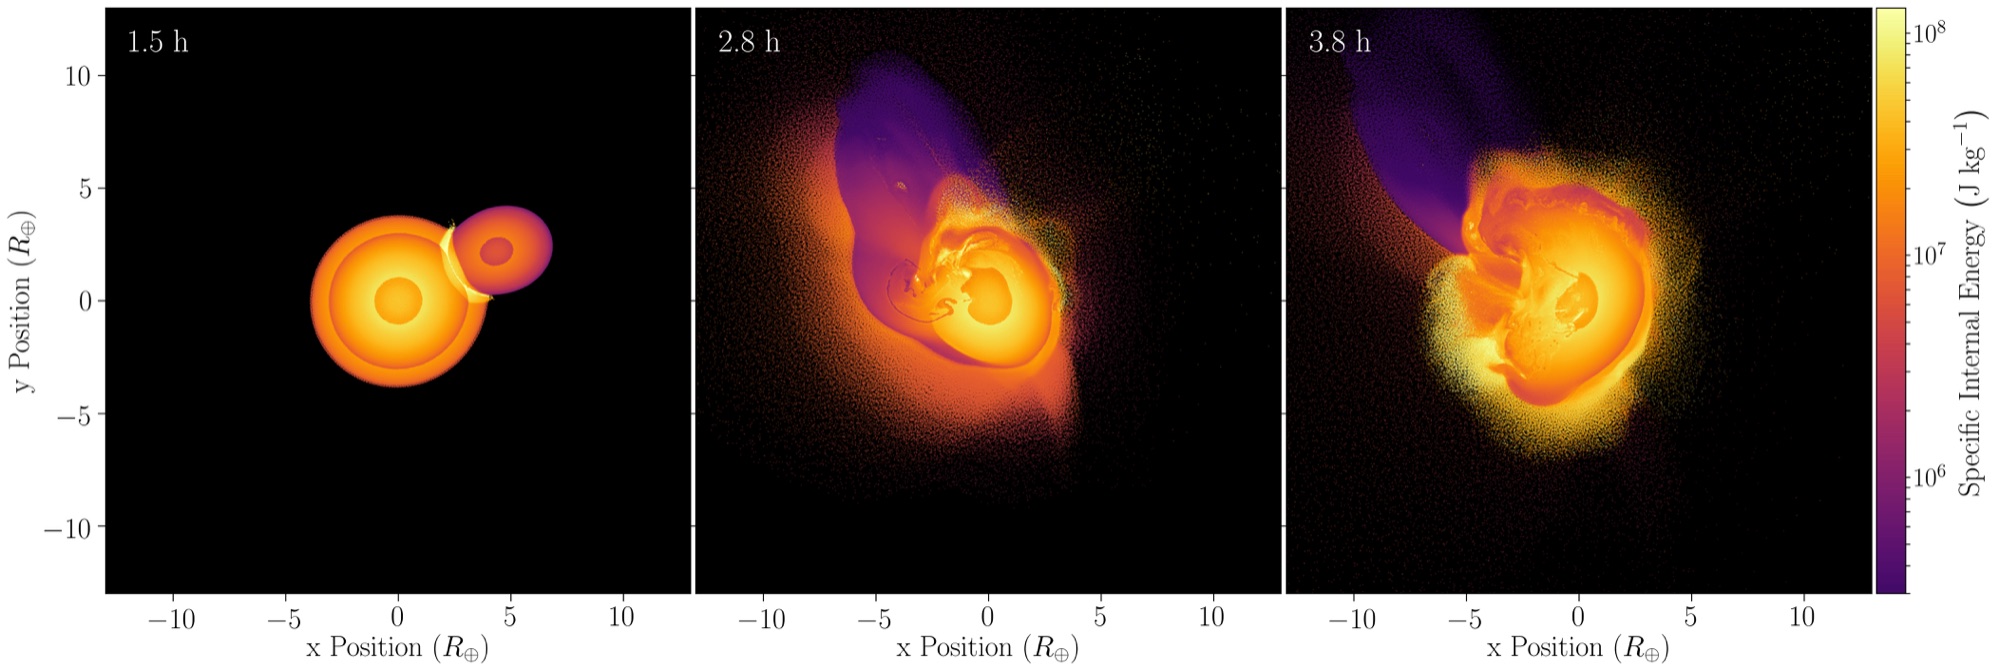 | Mid-collision snapshots from a smoothed particle hydrodynamics (SPH) simulation with over 10 million particles, coloured by their internal energy. |
Water ice on the Moon. Neutron spectroscopy provides a way from orbit to map the hydrogen abundance within the top metre of the surface. The Lunar Prospector Neutron Spectrometer did just this in 1998. Using image reconstruction algorithms, we sharpened up the hydrogen maps to show for the first time that the permanently shaded cold traps near to the lunar poles were special, typically containing more hydrogen than the surrounding terrain. See http://ukads.nottingham.ac.uk/abs/2009Icar..200...12E for more details.
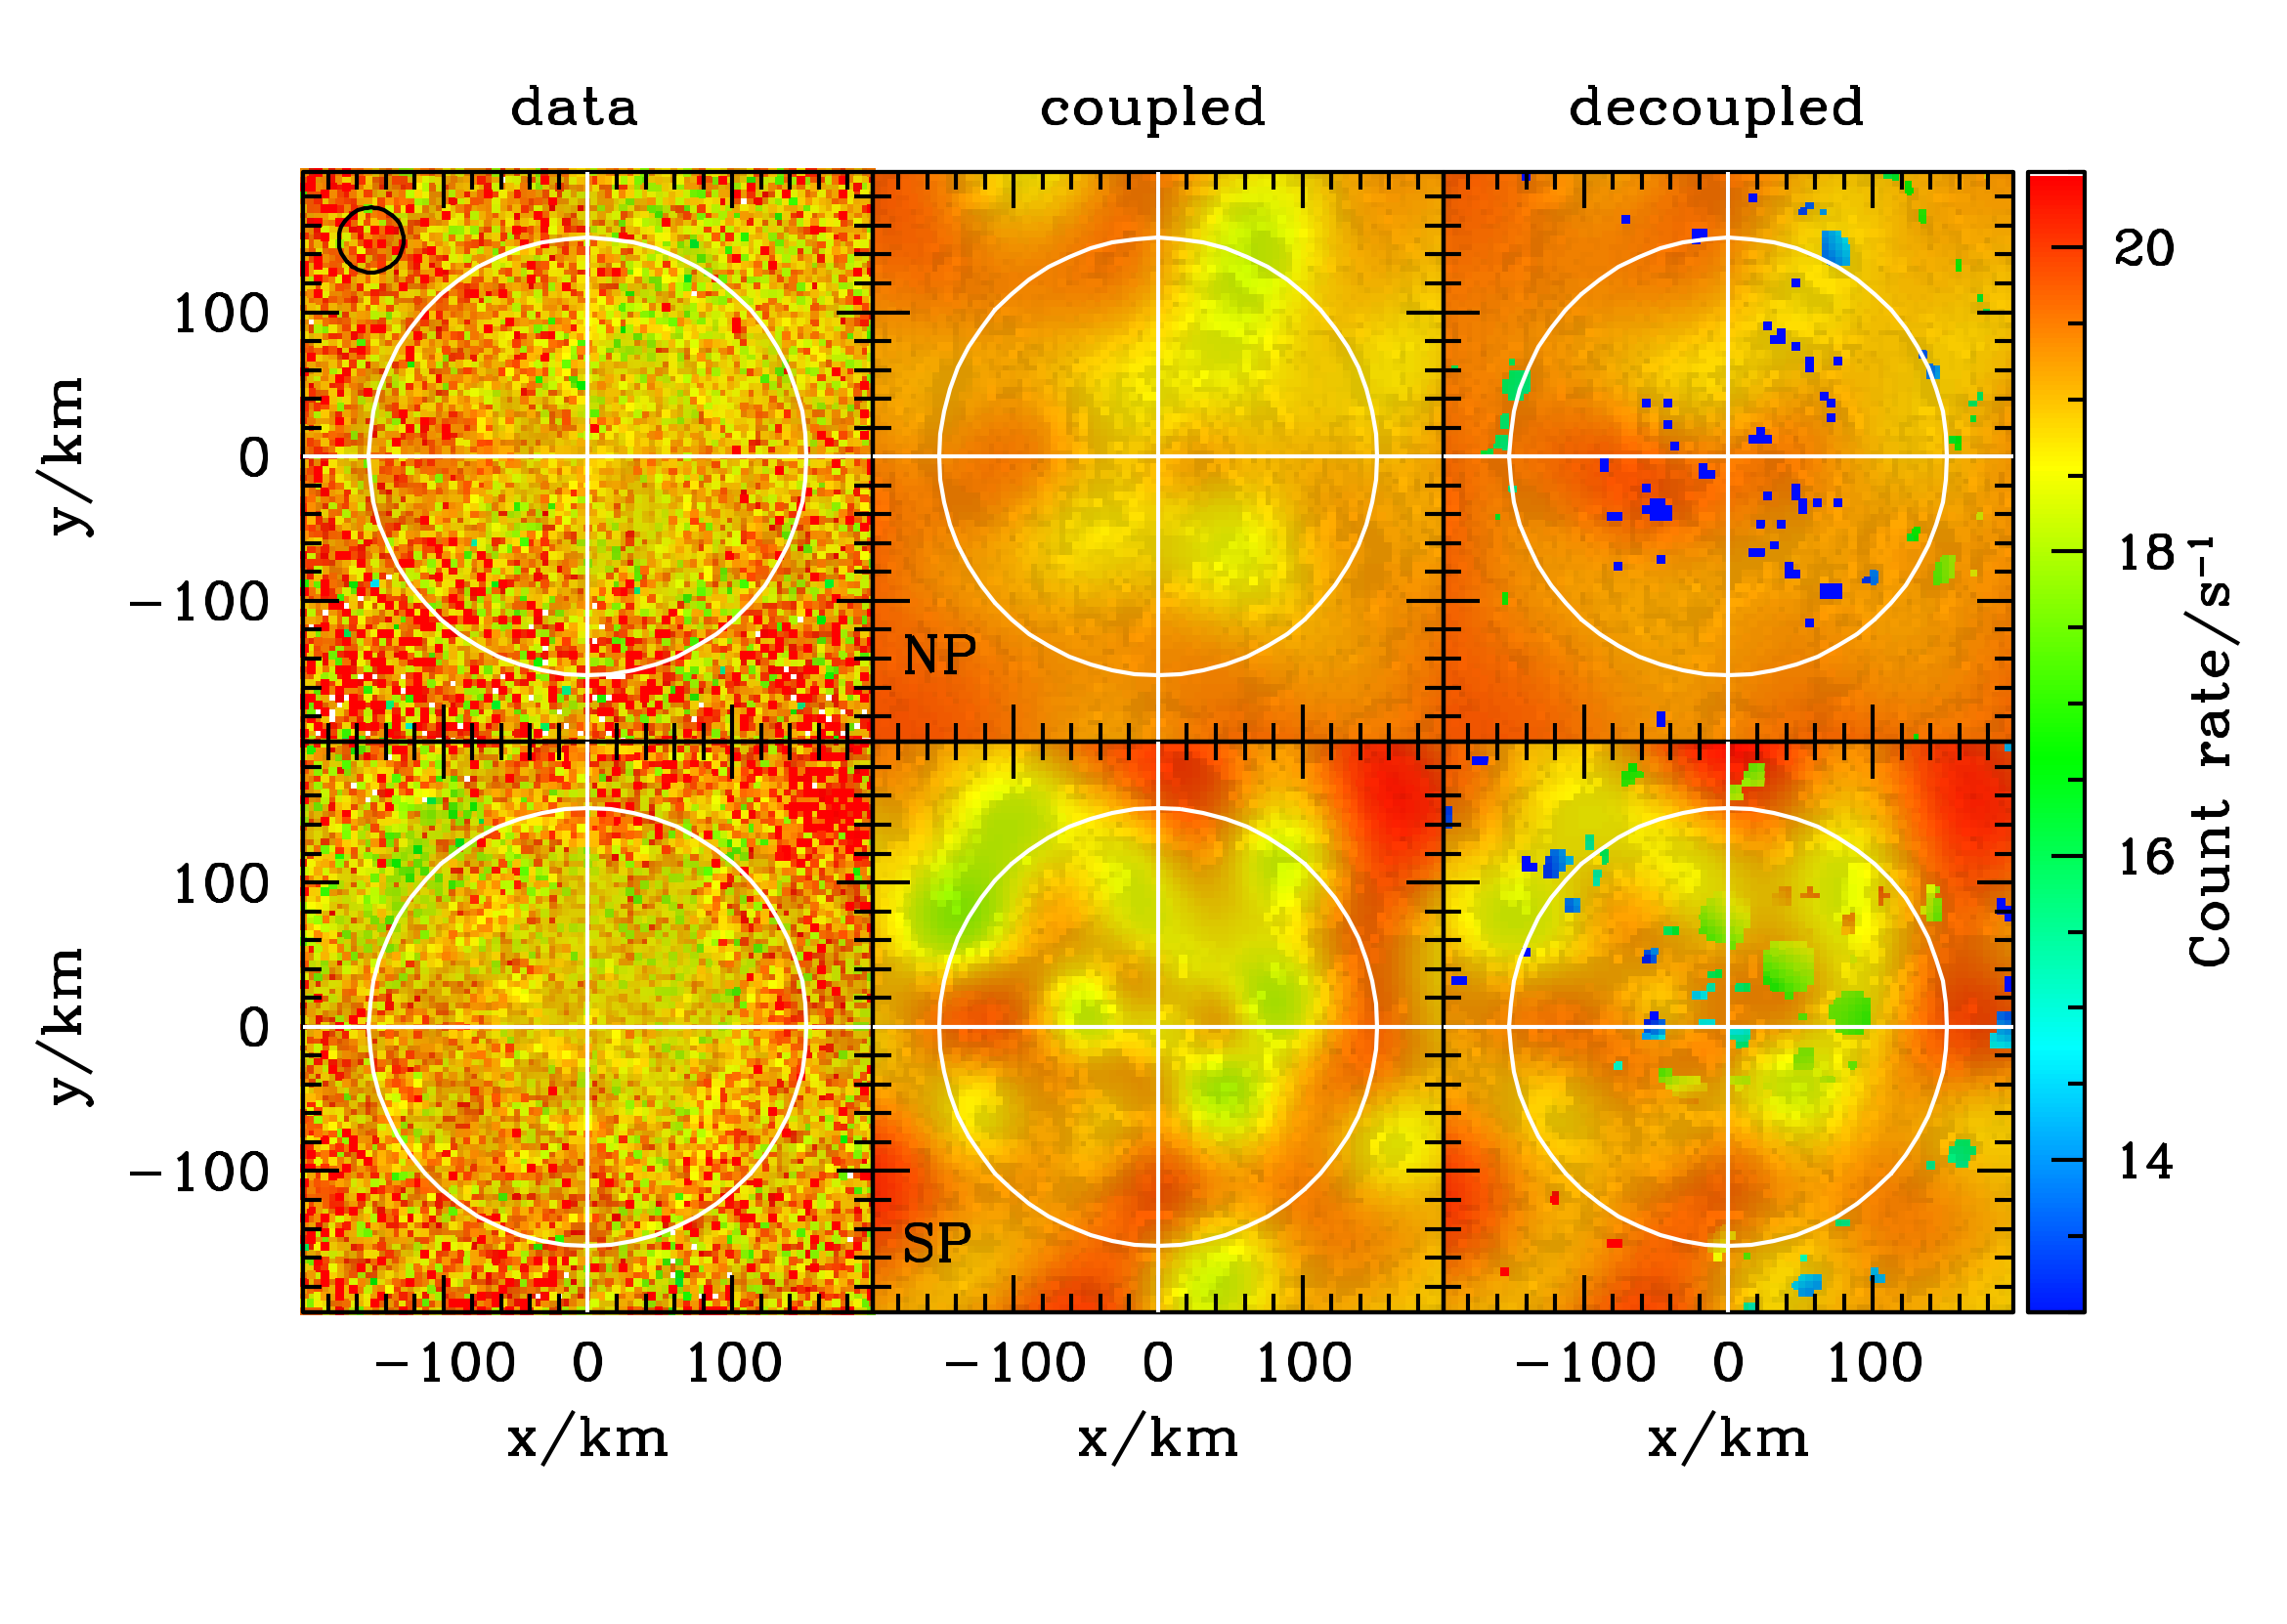 | Epithermal count rate maps for the north (top) and south (bottom) poles. The data, coupled, and decoupled reconstructions are shown in the different columns. The white circles represent a latitude of 85°. Also shown, with a black circle is the effective size of Lunar Prospector's response function. High count rates imply less near-surface hydrogen. Clementine imaging is shown in the background. |
Water ice on Mars.
We developed the first pixon image reconstruction algorithm that does
a full spherical surface reconstruction of a data set. Applying this
to data from the Mars Odyssey Neutron Spectrometer (MONS) allowed us to
increase the spatial resolution from a full-width half-maximum of
520km to 290km. This improved spatial resolution reveals extra
features and allows a more accurate quantification of the evolution of
the seasonal polar caps.
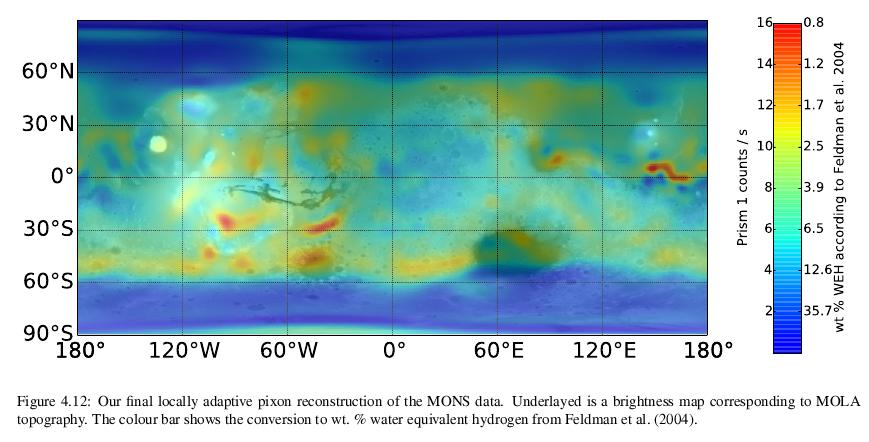 Credit: J.T.Wilson, 2016, PhD Thesis, Durham University.
Water ice on Mercury. Radar data show evidence for thick deposits of water ice in the permanently shaded regions near to Mercury's poles. Using the digital elevation map (DEM) for the north pole constructed using data from the Mercury Laser Altimeter on NASA's MESSENGER spacecraft, the thickness of these deposits has been investigated. Firstly, we designed a crater-finding algorithm to use the DEM to construct a catalogue of craters. Taking a young, well-sampled subset of craters, and assuming that they would be axisymmetric in the absence of any ice deposits, we determined that the ice thickness was 50+/-35m. This is the most accurate measurement available to date.
| MLA GDR DEM, colour-coded by height. Magenta circles show the radar-bright craters used in http://lanl.arxiv.org/abs/1611.05395, whereas the radar-dark control crater sample are shown with black circles. Radar-bright pixels are shown in white. | 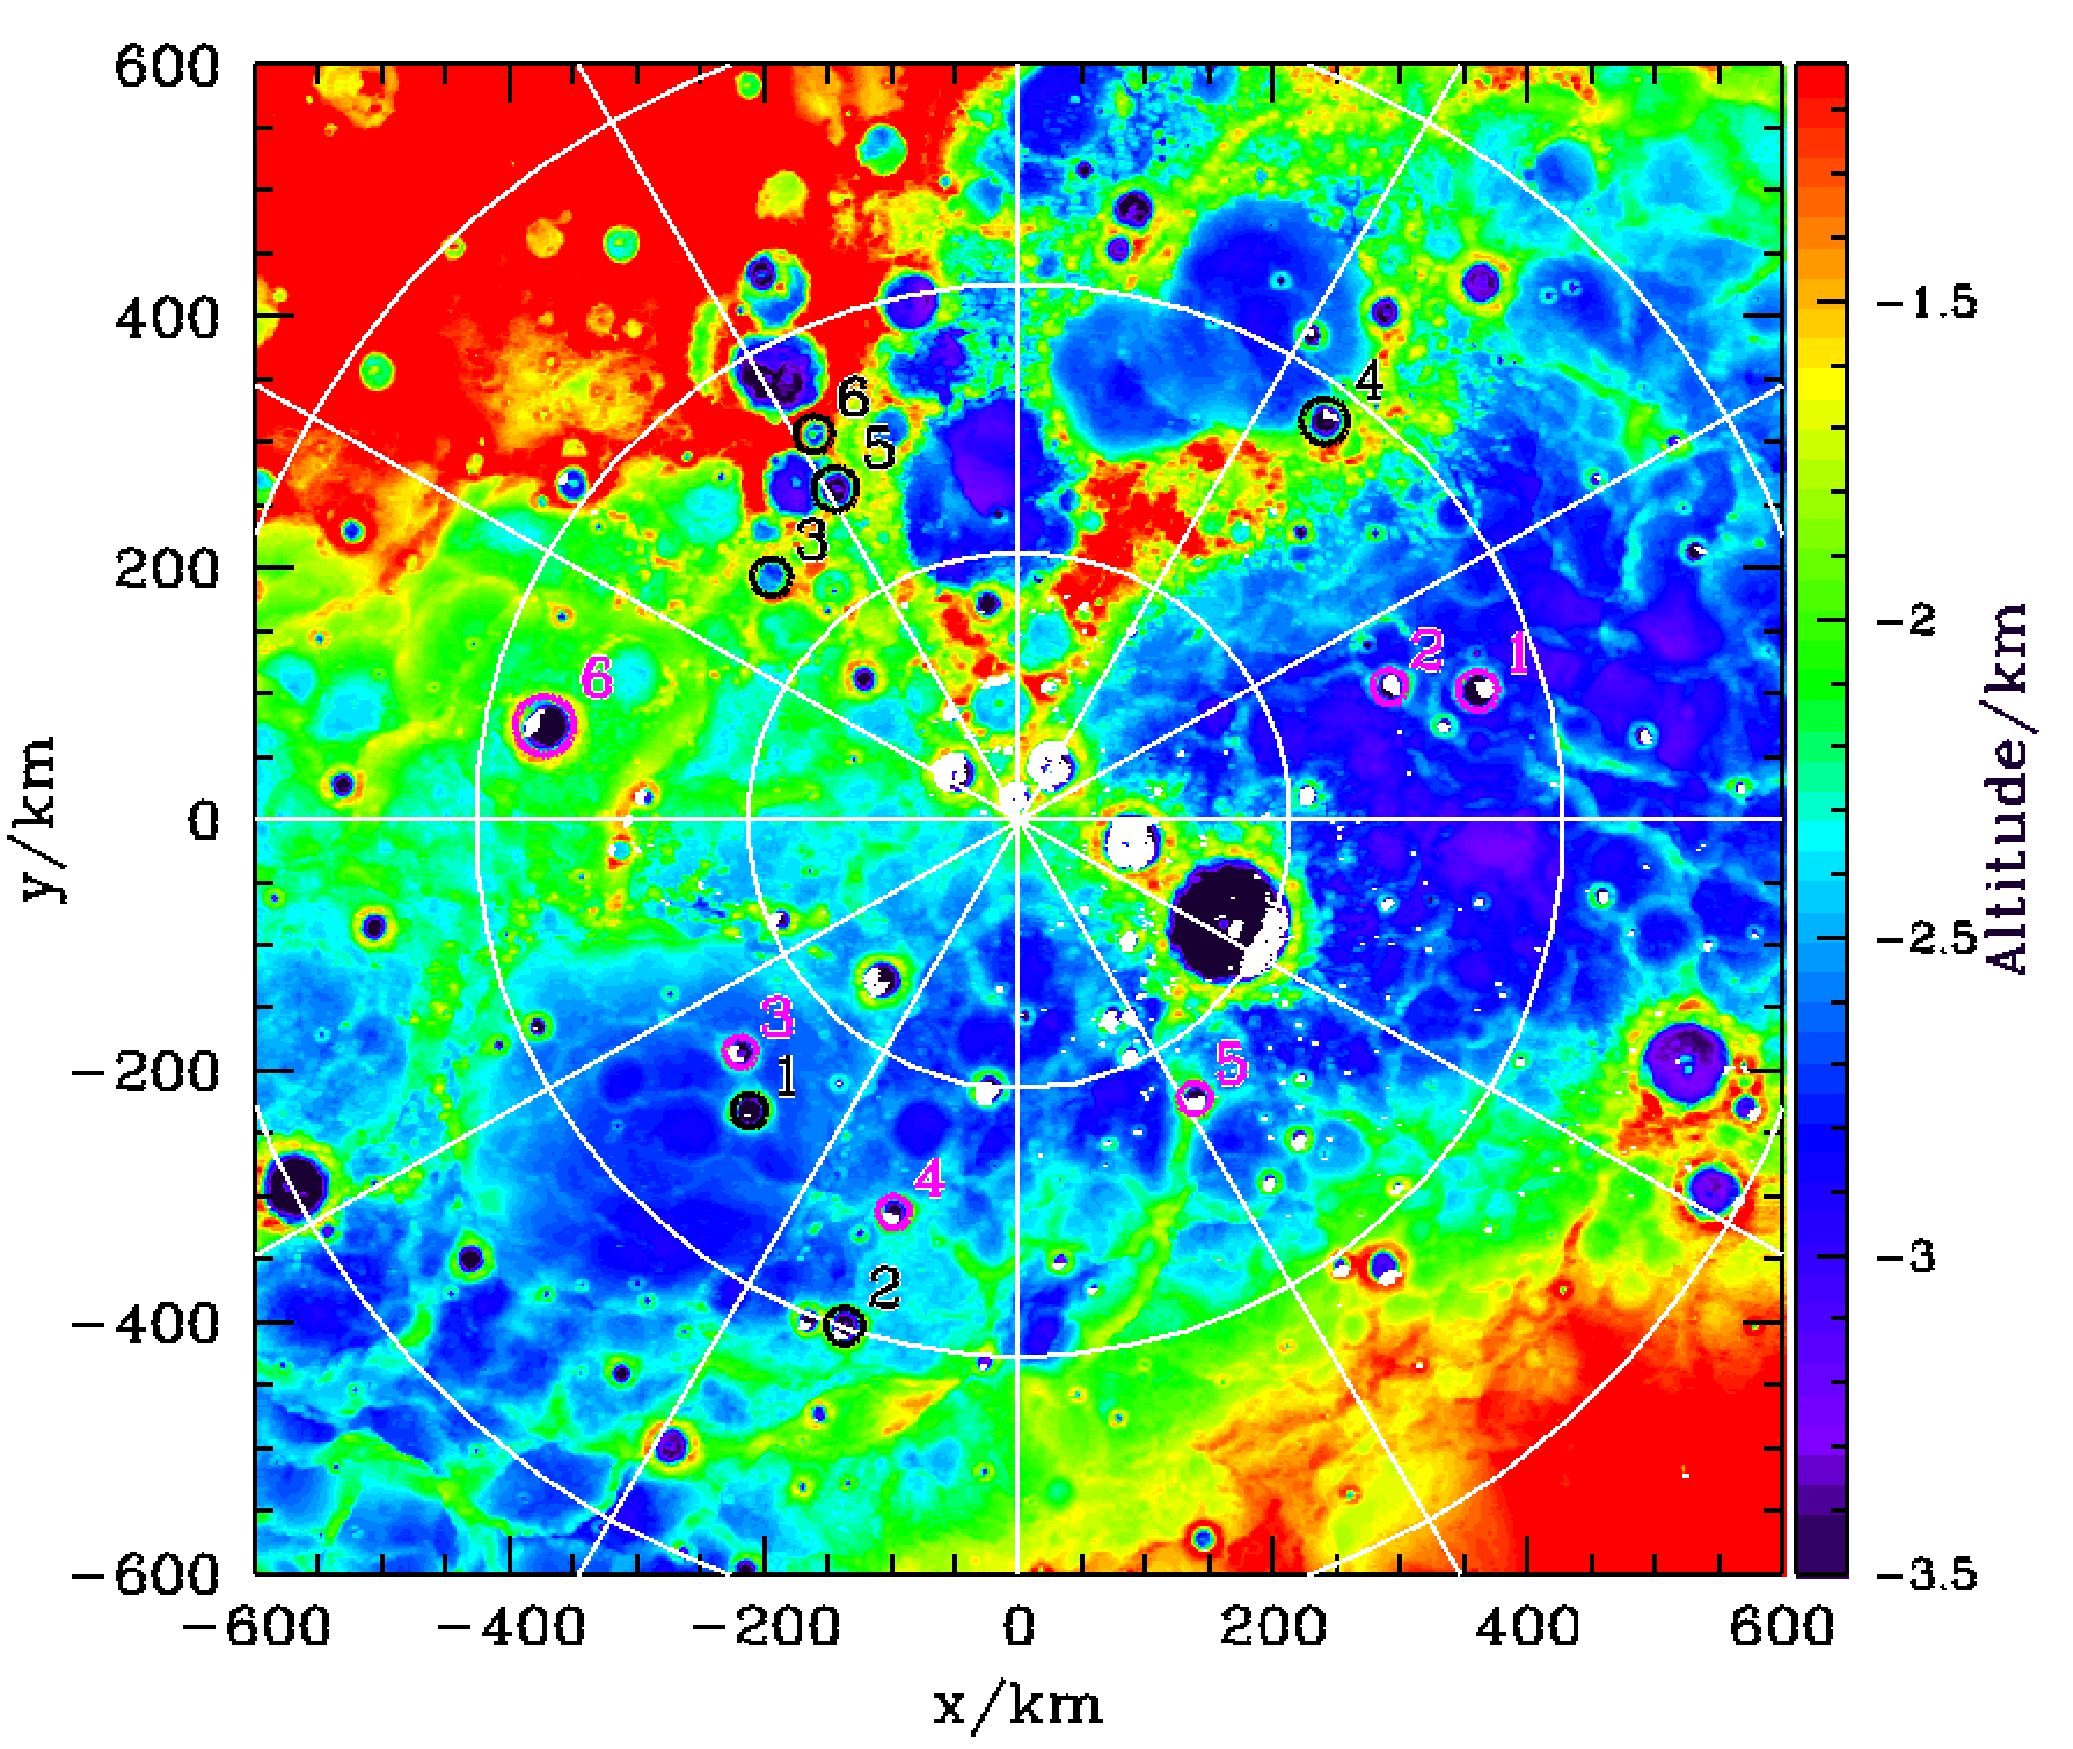 |
The lunar argon exosphere. Radioactive decay of potassium in the Moon's outer layers produces argon that leaks to the Moon's surface. From here it enters the lunar exosphere for a short while before either being lost due to interactions with radiation from the sun or sticking in a polar cold trap. Studying the lunar argon exosphere can teach us about the solar wind, the lunar interior and outgassing, the efficiency of volatile sequestration in polar cold traps and the kinetics of adsorption and desorption in low pressure environments. By performing Monte Carlo simulations of the transport of argon molecules through the exosphere, we have shown that only a localised source of argon can explain the persistent excess observed over the western maria. We also produced the first simulations to show that the long-term fluctuations in the exosphere's global argon density could be explained by seasonal variations in the polar cold traps. Our Monte Carlo code can be downloaded from the following directory: http://icc.dur.ac.uk/~vreke/solarsystem/exosphere/. See http://ukads.nottingham.ac.uk/abs/2017JGRE..122.2163K for more details.
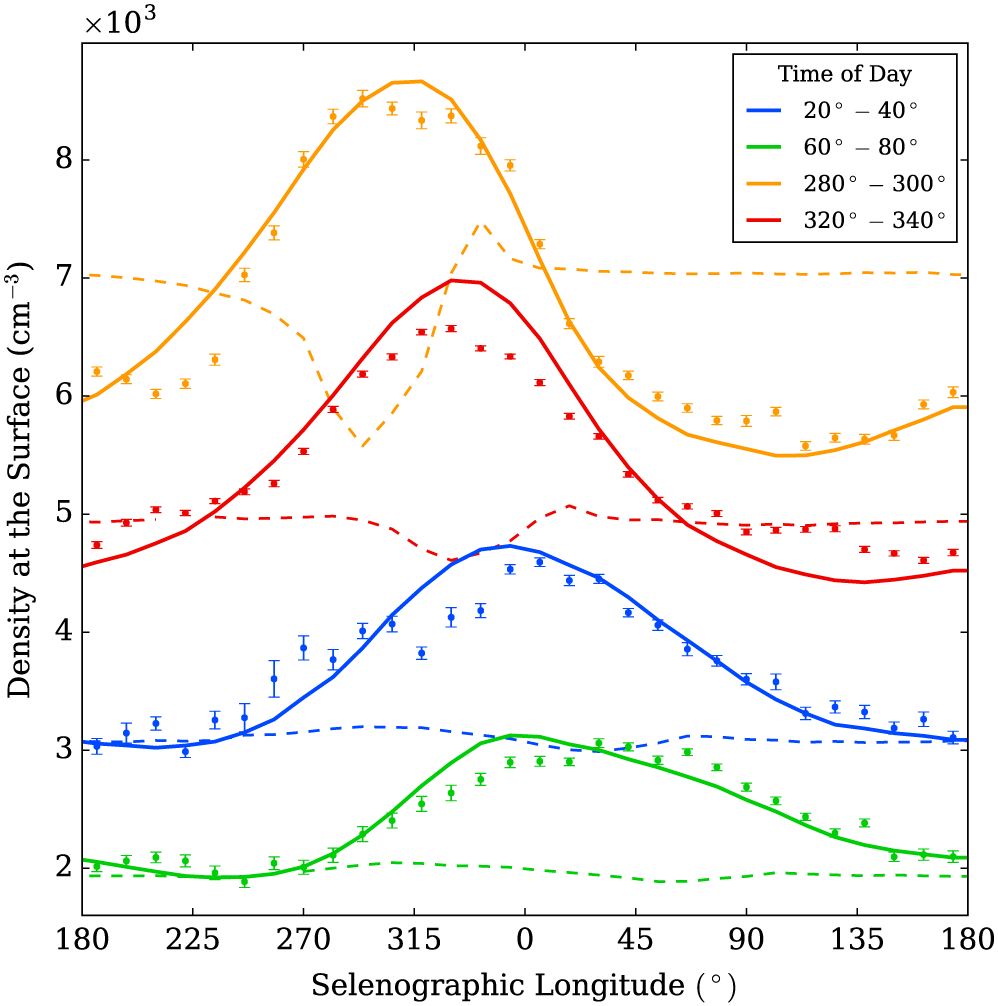 |
The variation of argon density with selenographic longitude for different times of lunar day shown by the different colours (noon is 0 degrees). Data from NASA's LADEE mission are shown with points, whereas the solid lines show the bulge from our local source model. The dashed lines show the results for a model with no local source that has a lower desorption energy in the mare region than in the highlands. |
Lunar thorium and Compton-Belkovich. Thorium comprises a large atom that does not easily fit into crystalline lattices. Such an incompatible element provides a valuable tracer of the history of the formation of the Moon from its early lunar magma ocean state. Using Lunar Prospector's Gamma Ray Spectrometer it is possible to map the thorium abundance by detecting its radioactive decay. We used image reconstruction techniques to create a sharp map of thorium in the region of the Compton-Belkovich volcanic complex. This revealed evidence for the explosive eruption of silicic magma as having been responsible for the thorium distribution. See http://ukads.nottingham.ac.uk/abs/2015JGRE..120...92W for more details.